- CATALOGUE
- OF MAKING
CATALOGUE
OF MAKING
The Catalogue of Making is a collection of experimentations to explore the potential of generative visual systems as a means for the visual representation of personal identities in digital spaces.
These experiments seek to investigate the question
“How can our identities be portrayed within the online space?”
AFFECTIVE
DATA OBJECTS
AFFECTIVE
DATA OBJECTS
CODED DATA OBJECTS
These are coded experimentations using P5.JS to generate 3D models. Different shapeforms such as spheres, cones, and boxes, were explored in the 3D space as a means to symbolise different emotional states.


Further explorations were designed in a 3D software to experiment with shapeform
and texture.
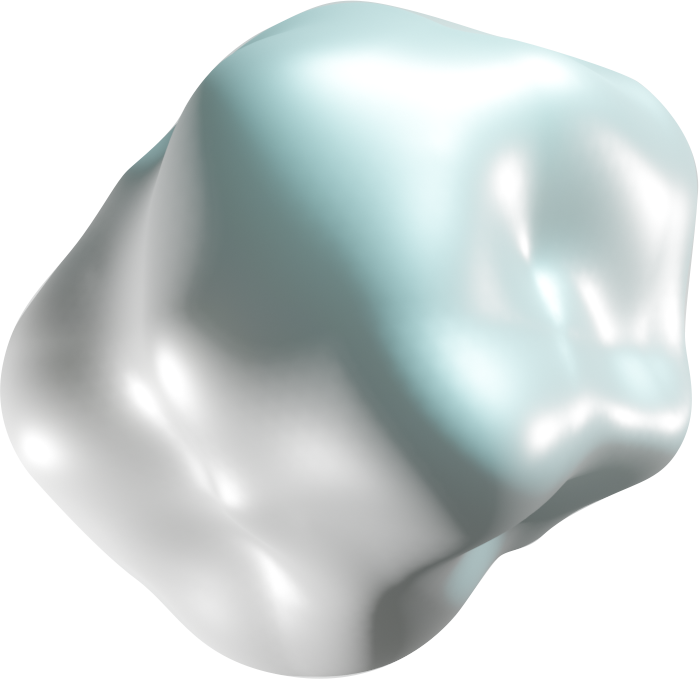
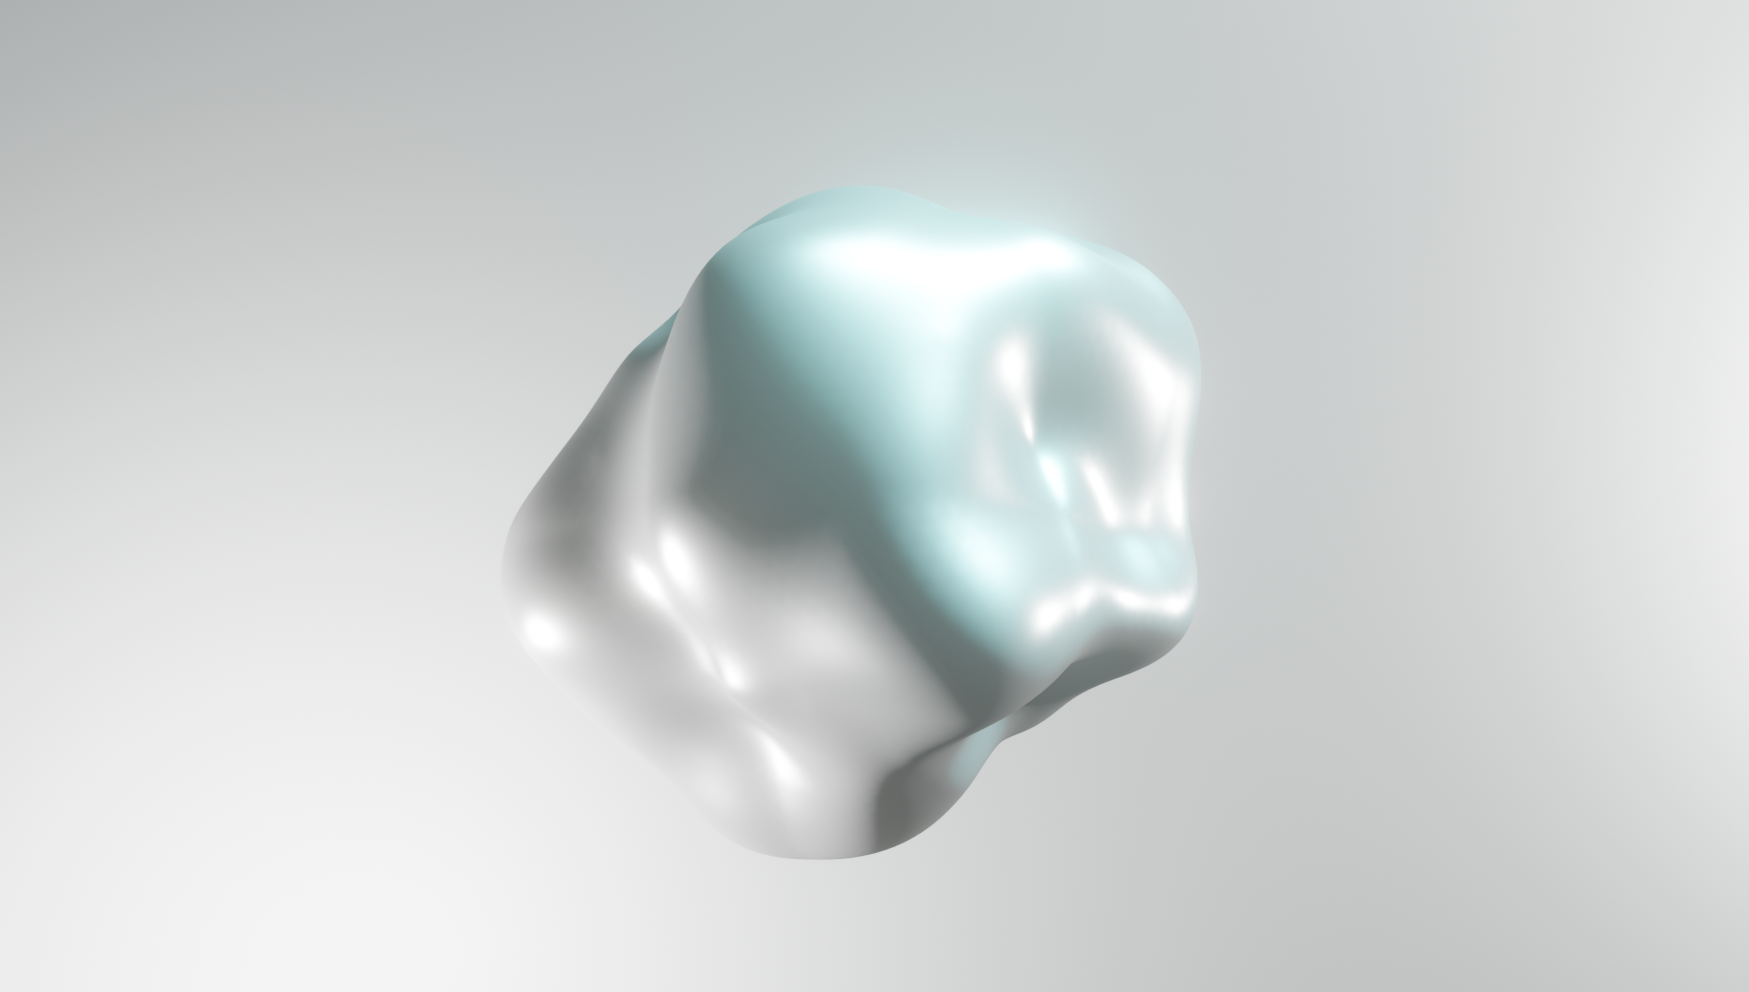
The Affective Data Objects are first designed in Blender, an open source 3D creation software, to construct 3D visuals that possess emotive qualities.


MIXED MEDIA
APPROACHES
This version of data objects experiments with both the computational and design mediums. The data objects are first modelled and designed in Blender as a 3D structure. Using p5.js as a programming platform to host the interaction of the data objects, the designed data objects are imported as obj. files and further refined using javascript.
The combination of approaches is mainly utilised as a means to make up for the limitations faced in both software. First, due to the flexibility and control limitations in p5.js, the data objects had to be designed manually to preserve distinctive characteristics with the structure to accurately portray emotional qualities. The generative power of programming software is put to use in engaging users with real-time interactive experiences.
The intercross between the two software provides a perfect blend of generative visuals. The data objects are further developed using javascript as a tool to animate the data objects, bringing life to the static models. The moving data objects bring forth an added value to the digital data objects as users are able to get a view of the data object as a whole. in addition, in p5.js ambient lights were added to simulate light refraction against the textures of the data object. This enables users without access to the physical data objects, to gain a sense of how the textures and shapes look in real life.

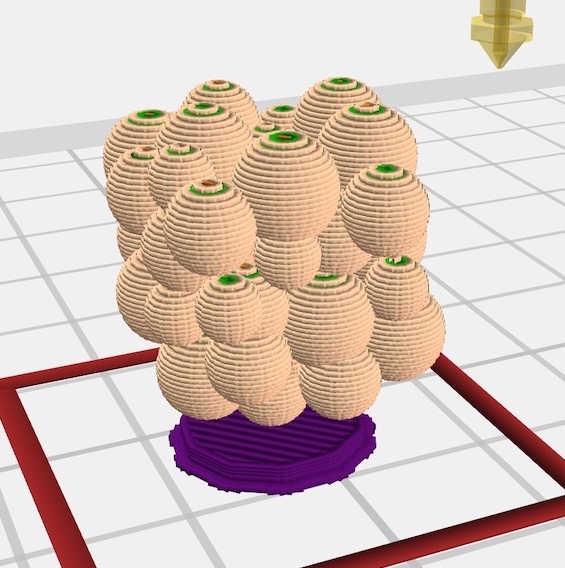
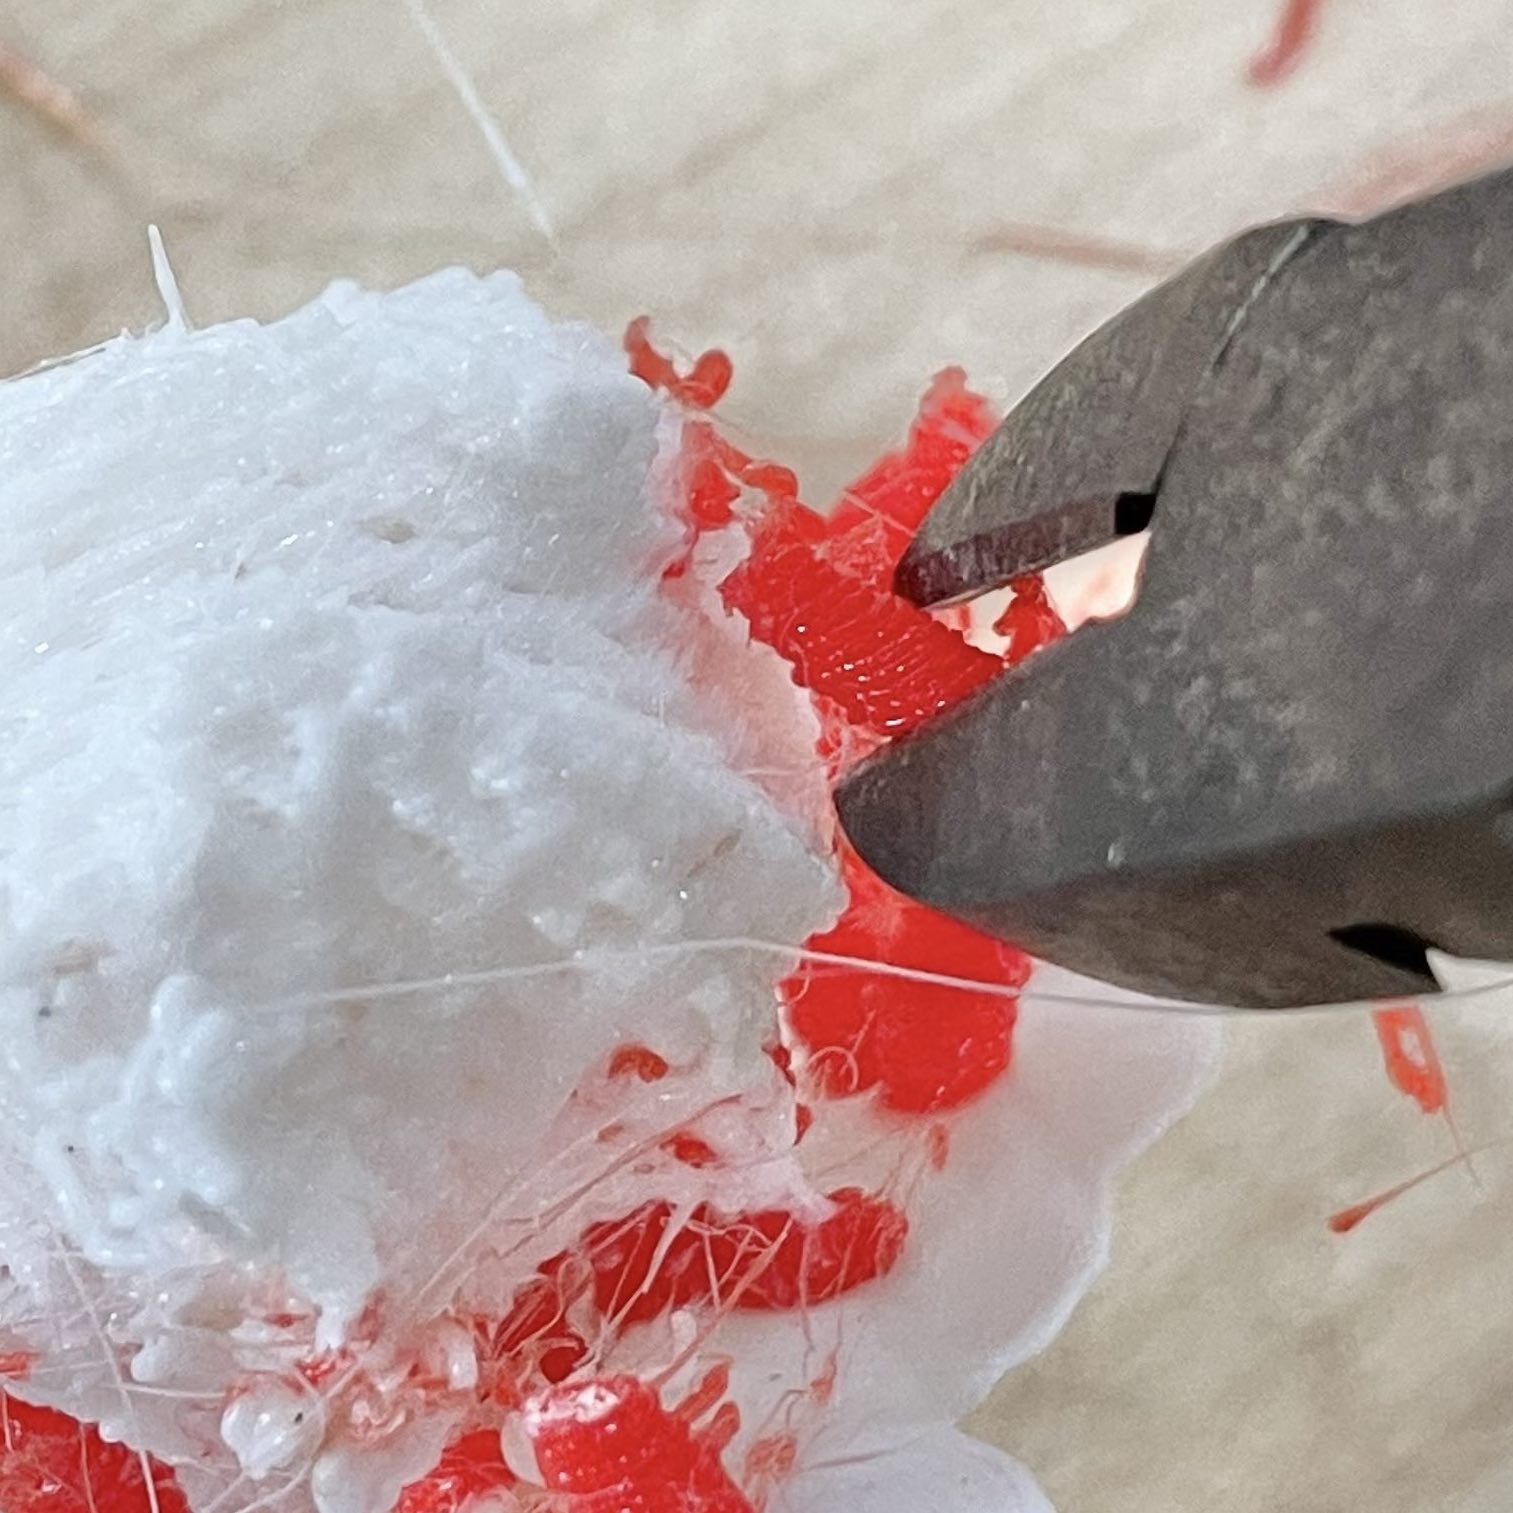
PHYSICALISATION
OF DATA OBJECTS
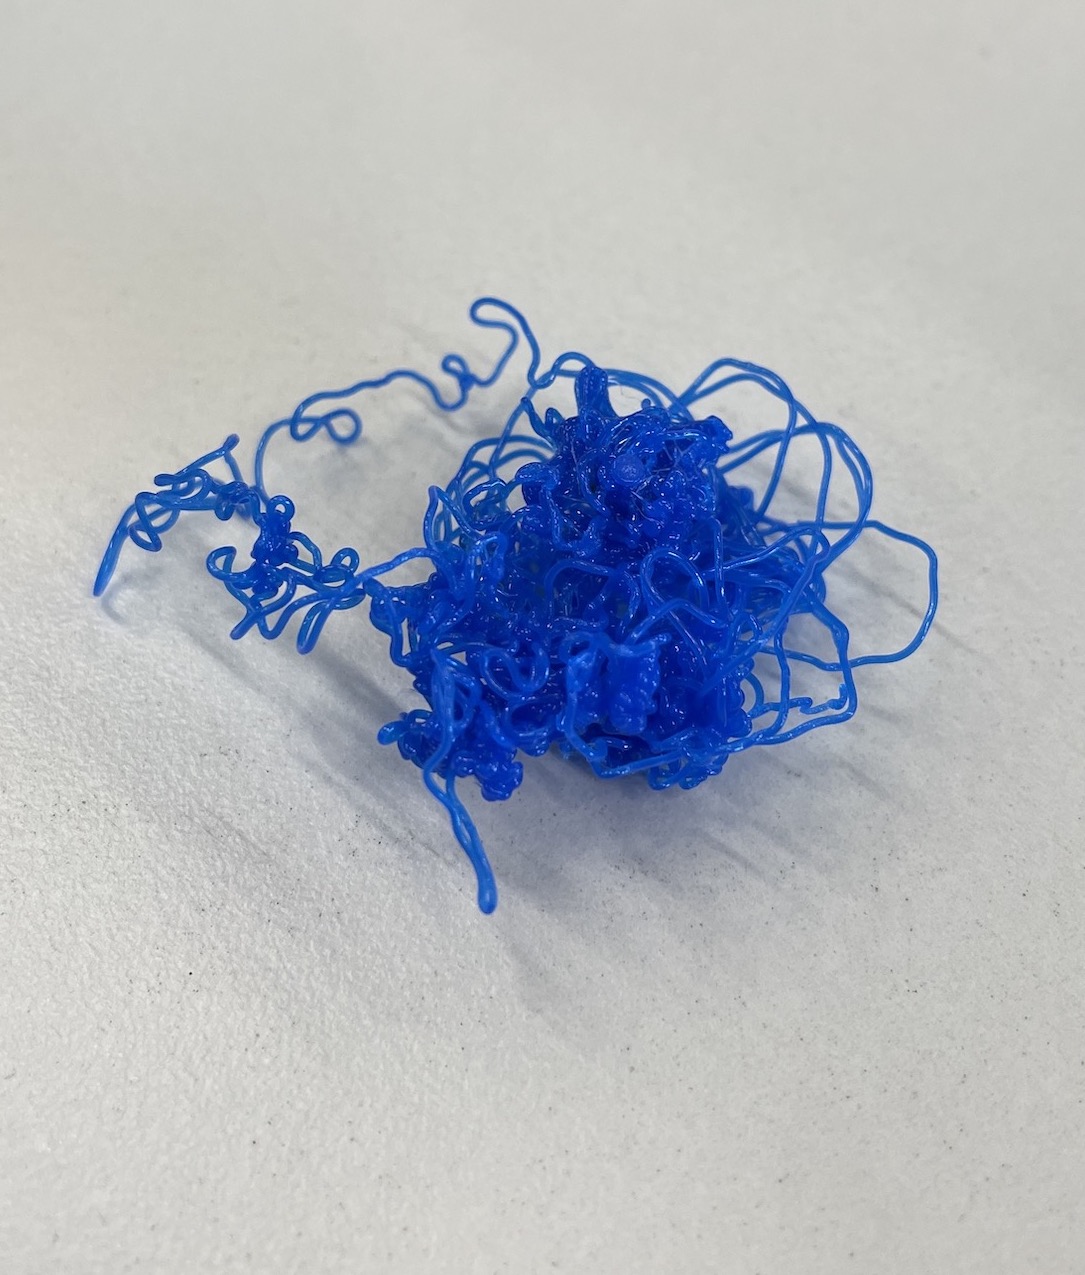
For the tangible prototype experience, the digital data objects are physicalised into interactive 3D printed objects. The designs are converted into printable formats through Flashprint and produced using Flashforge Creator Pro 2 3D printers. With careful consideration, the final material used to physicalise the Affective Data Objects is polylactic acid (PLA), a renewable polymer filament that possesses high print quality and durability in producing finely detailed crafts.
-

-
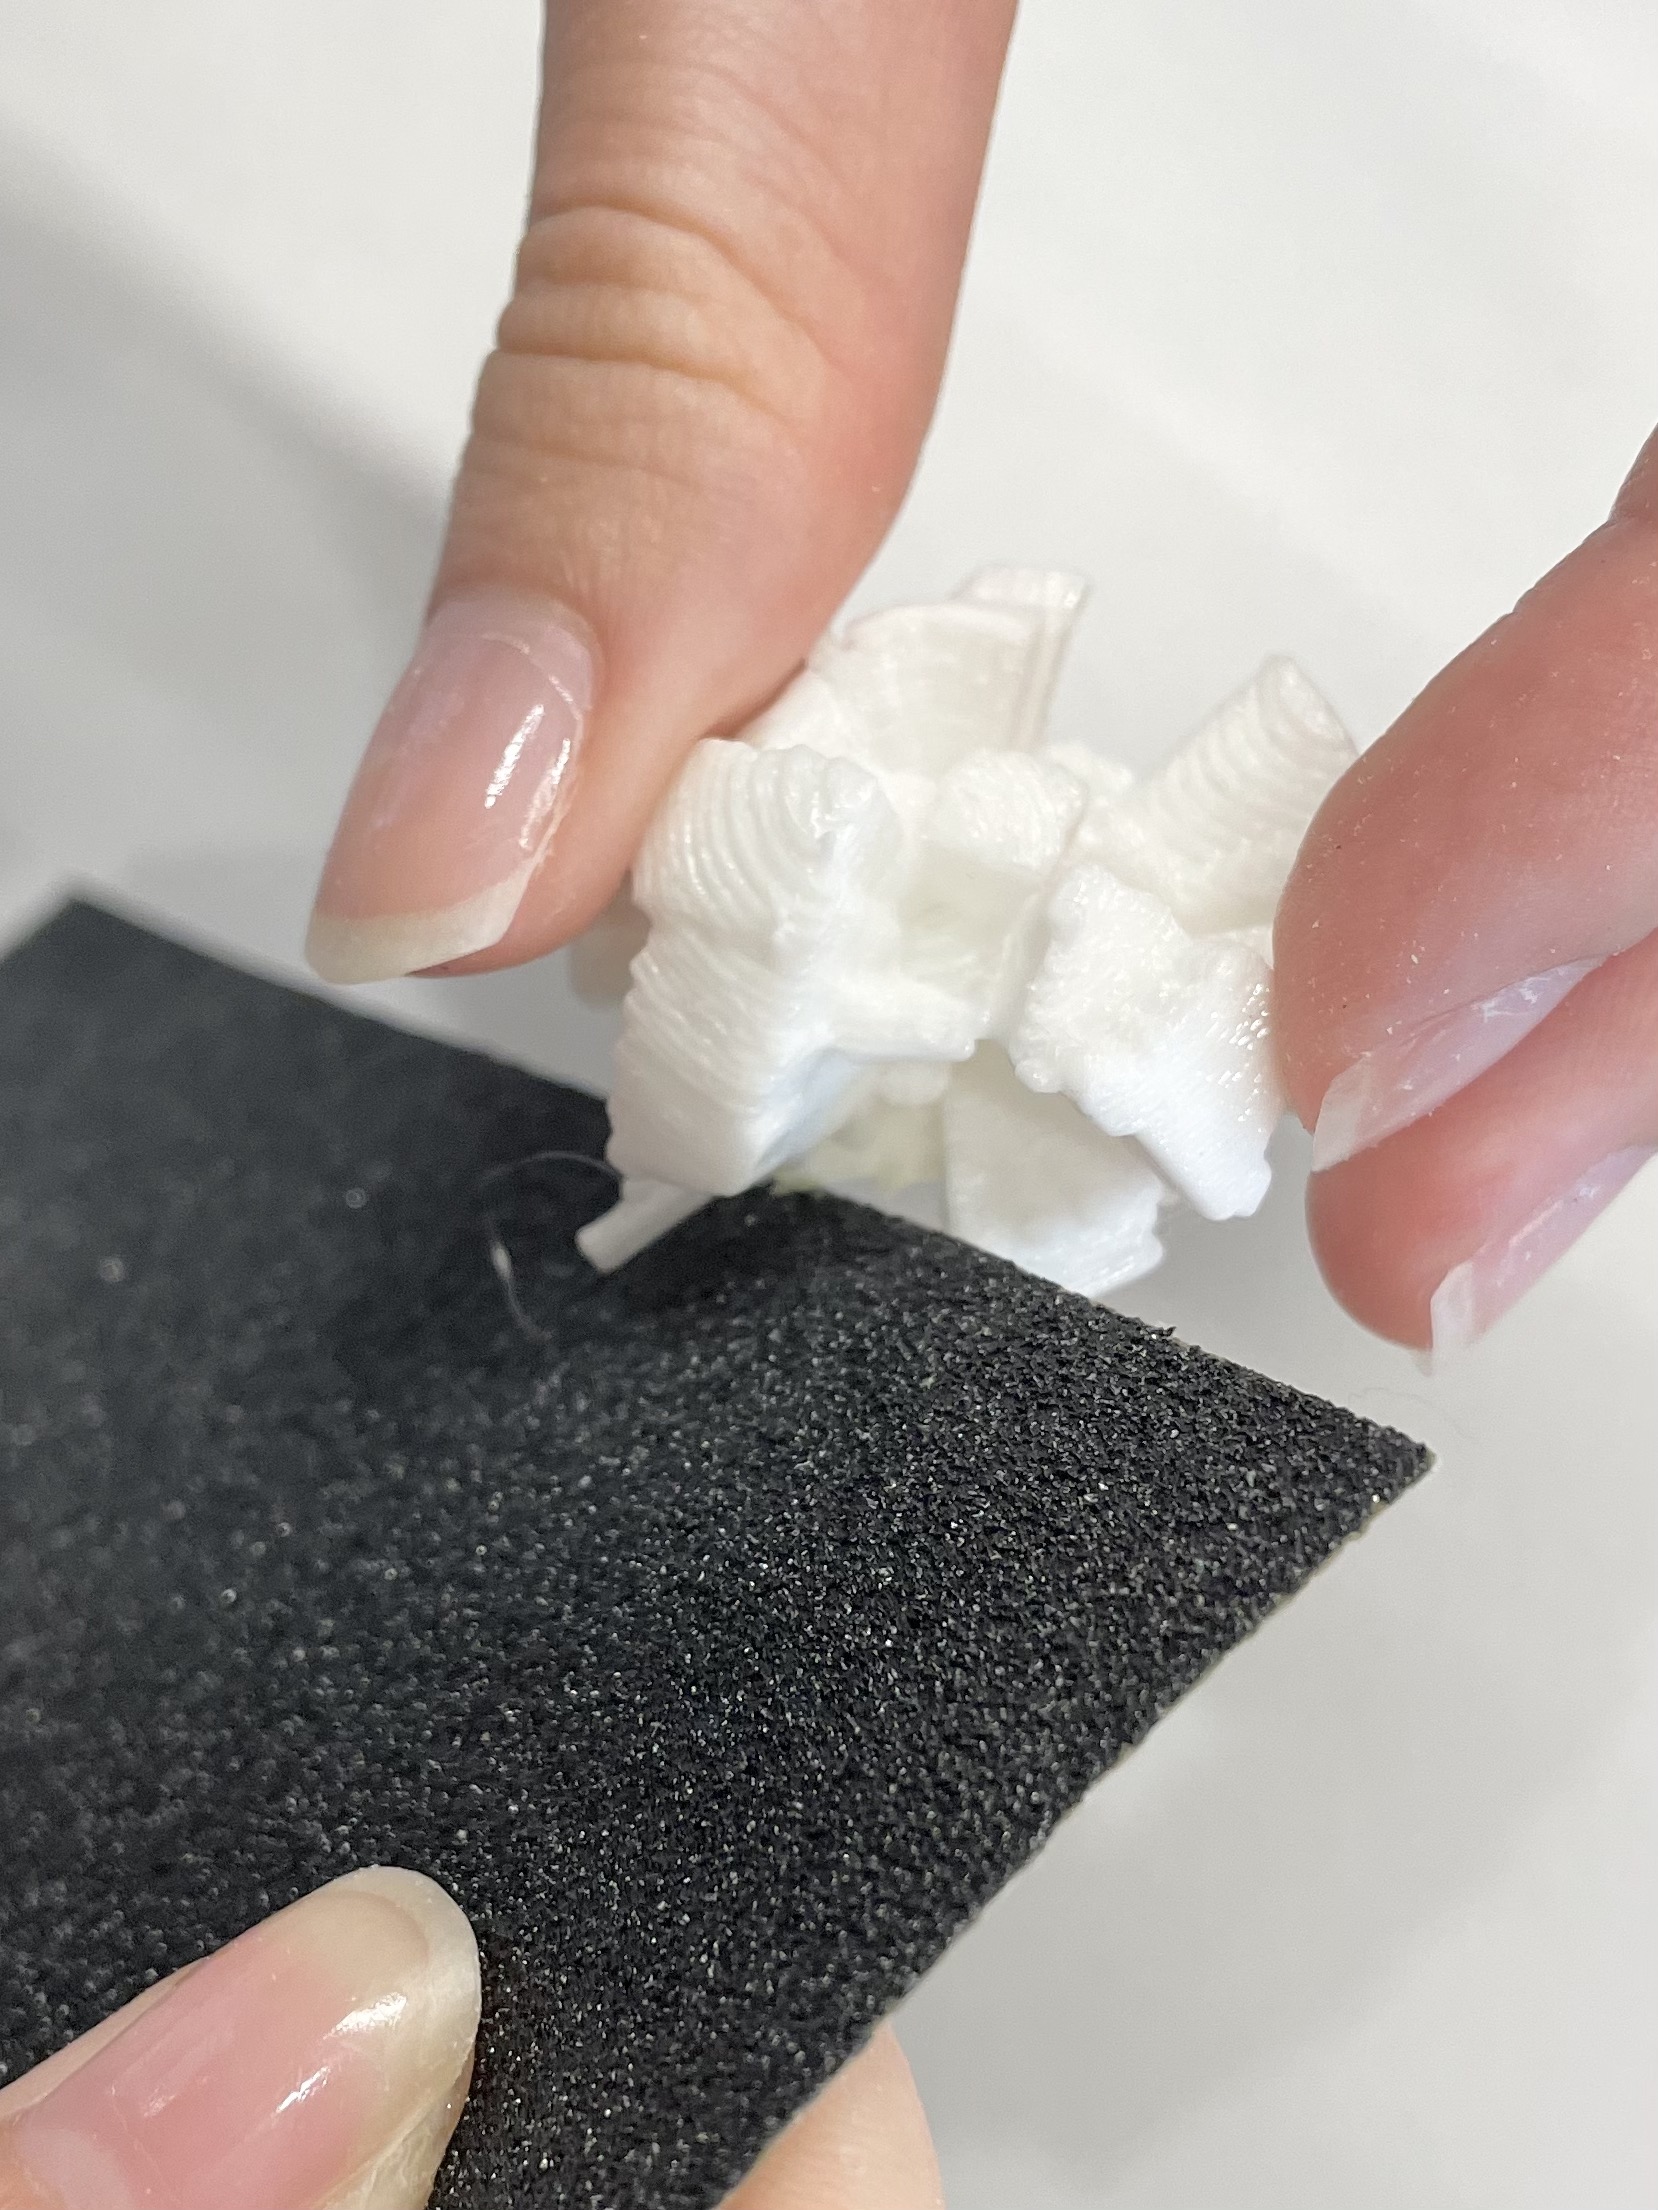
THE
MAKING
PROCESS
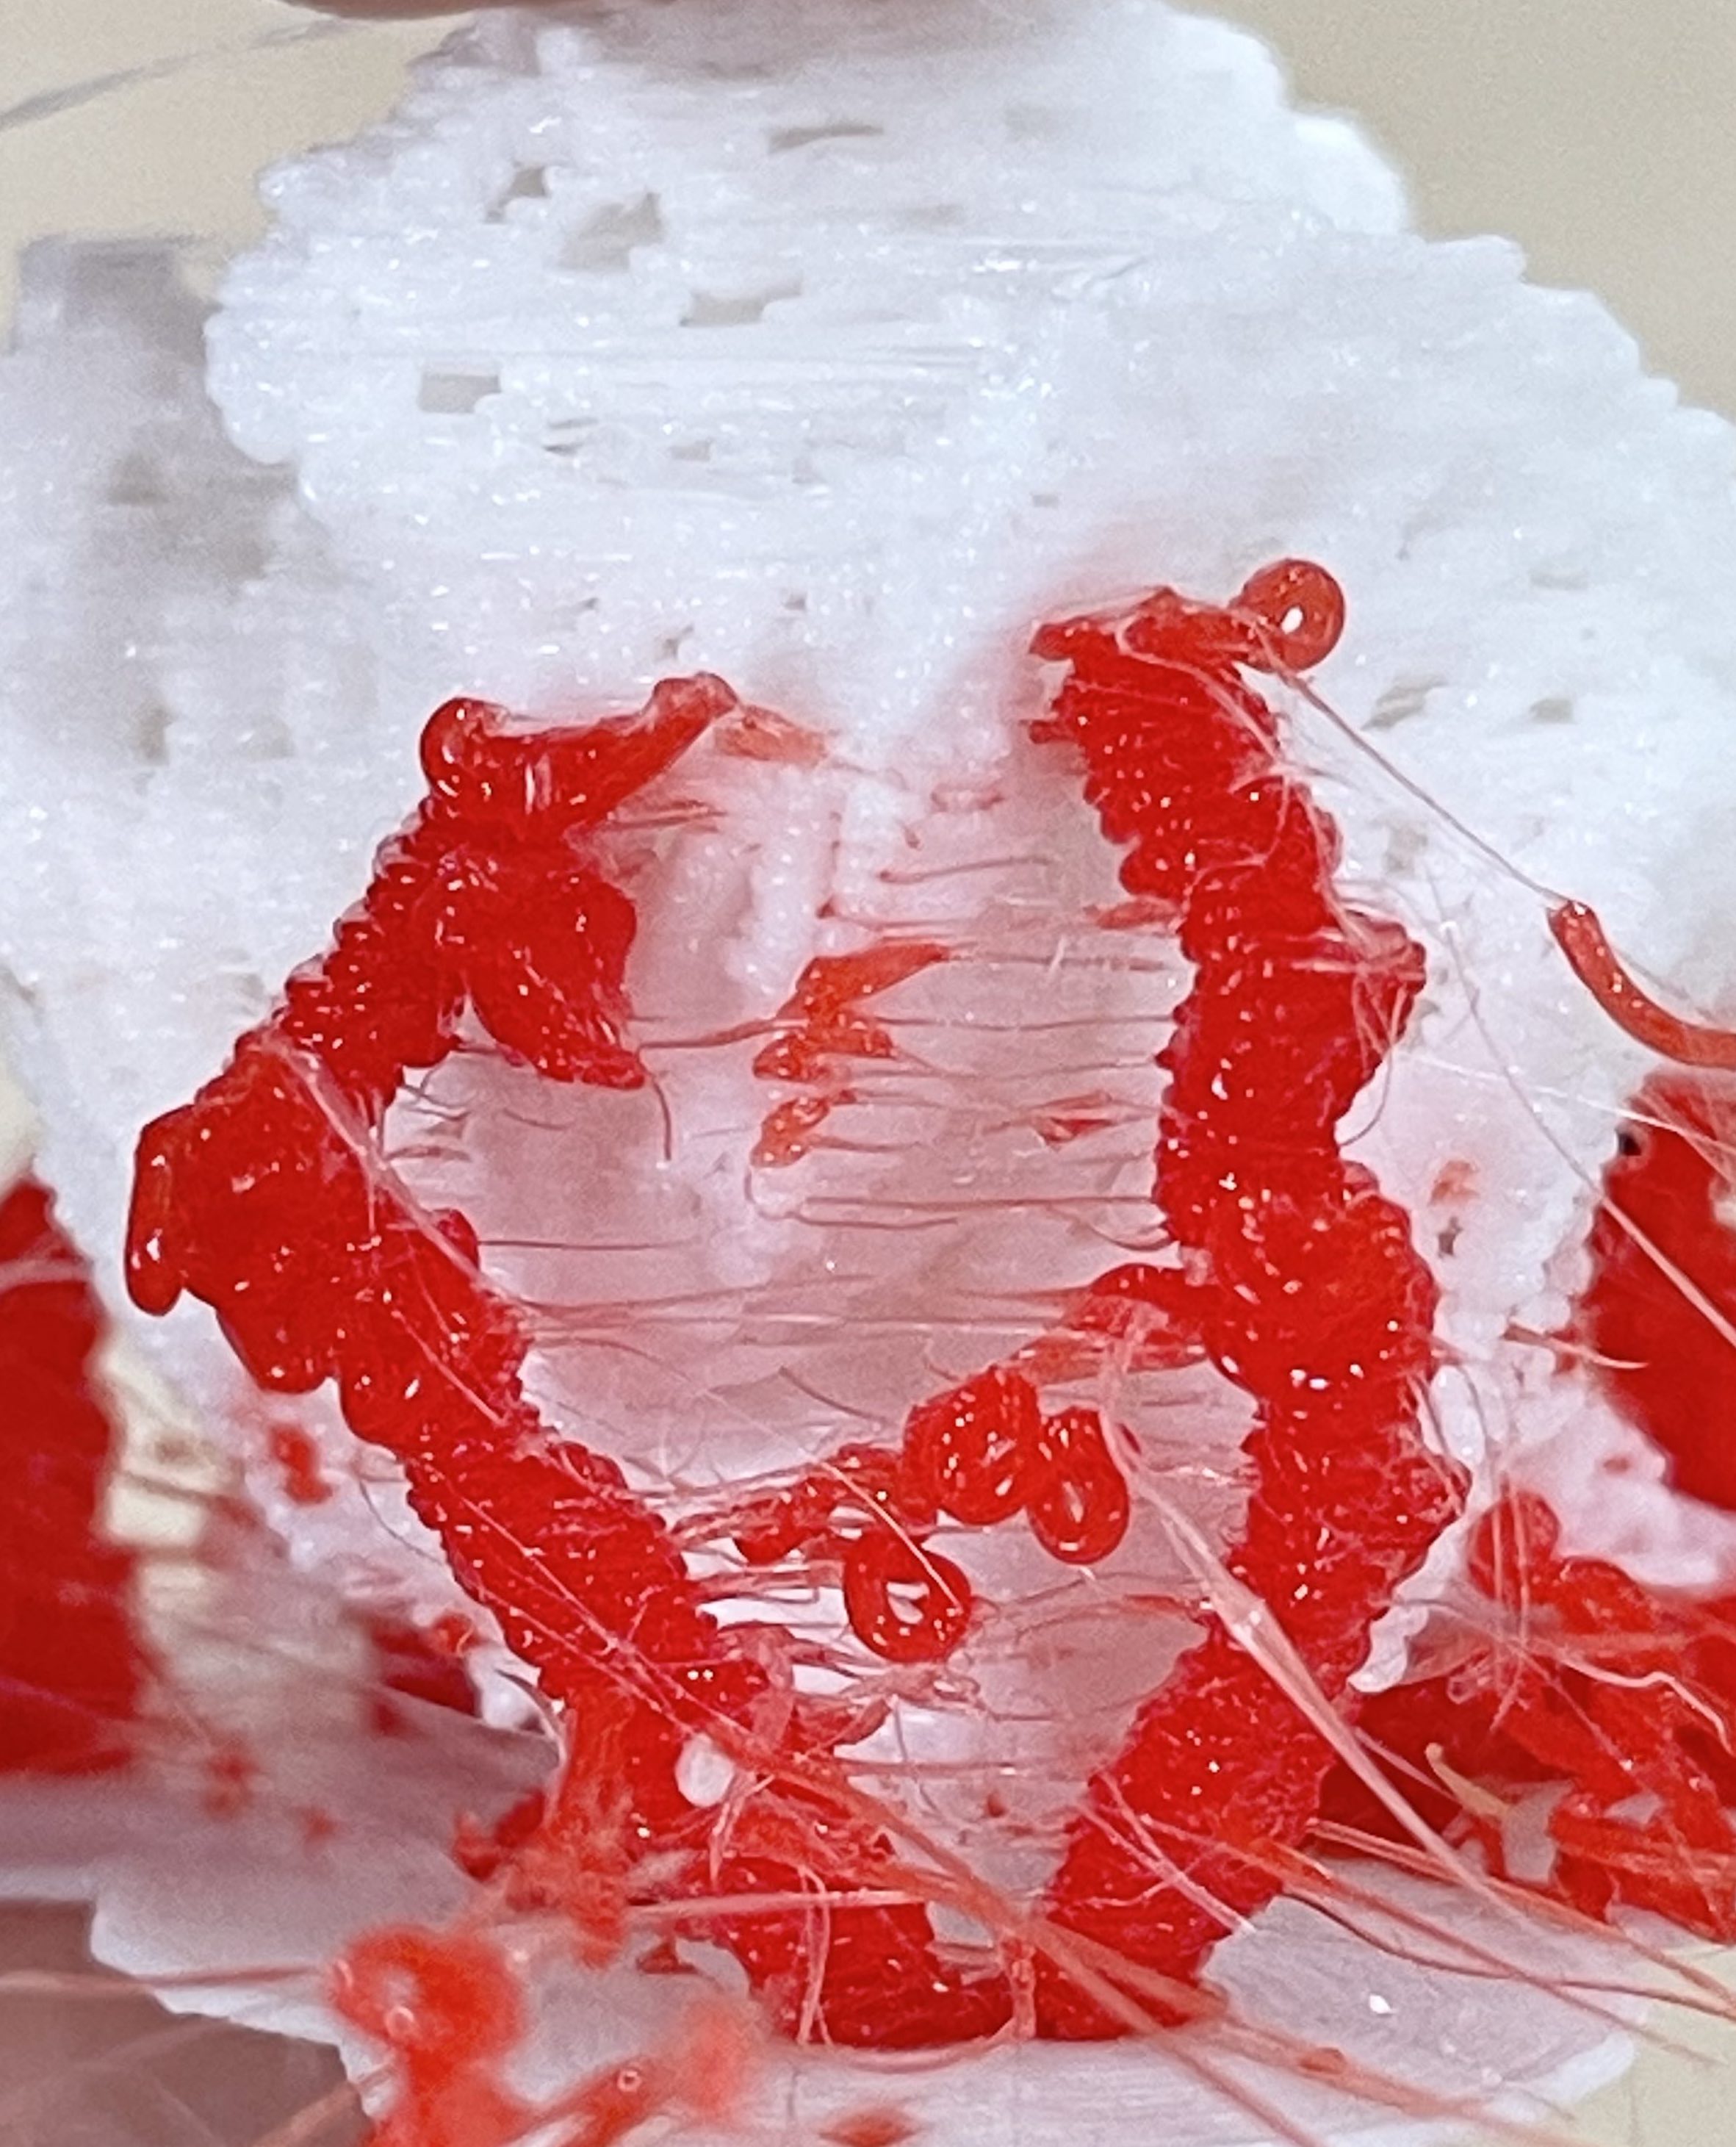
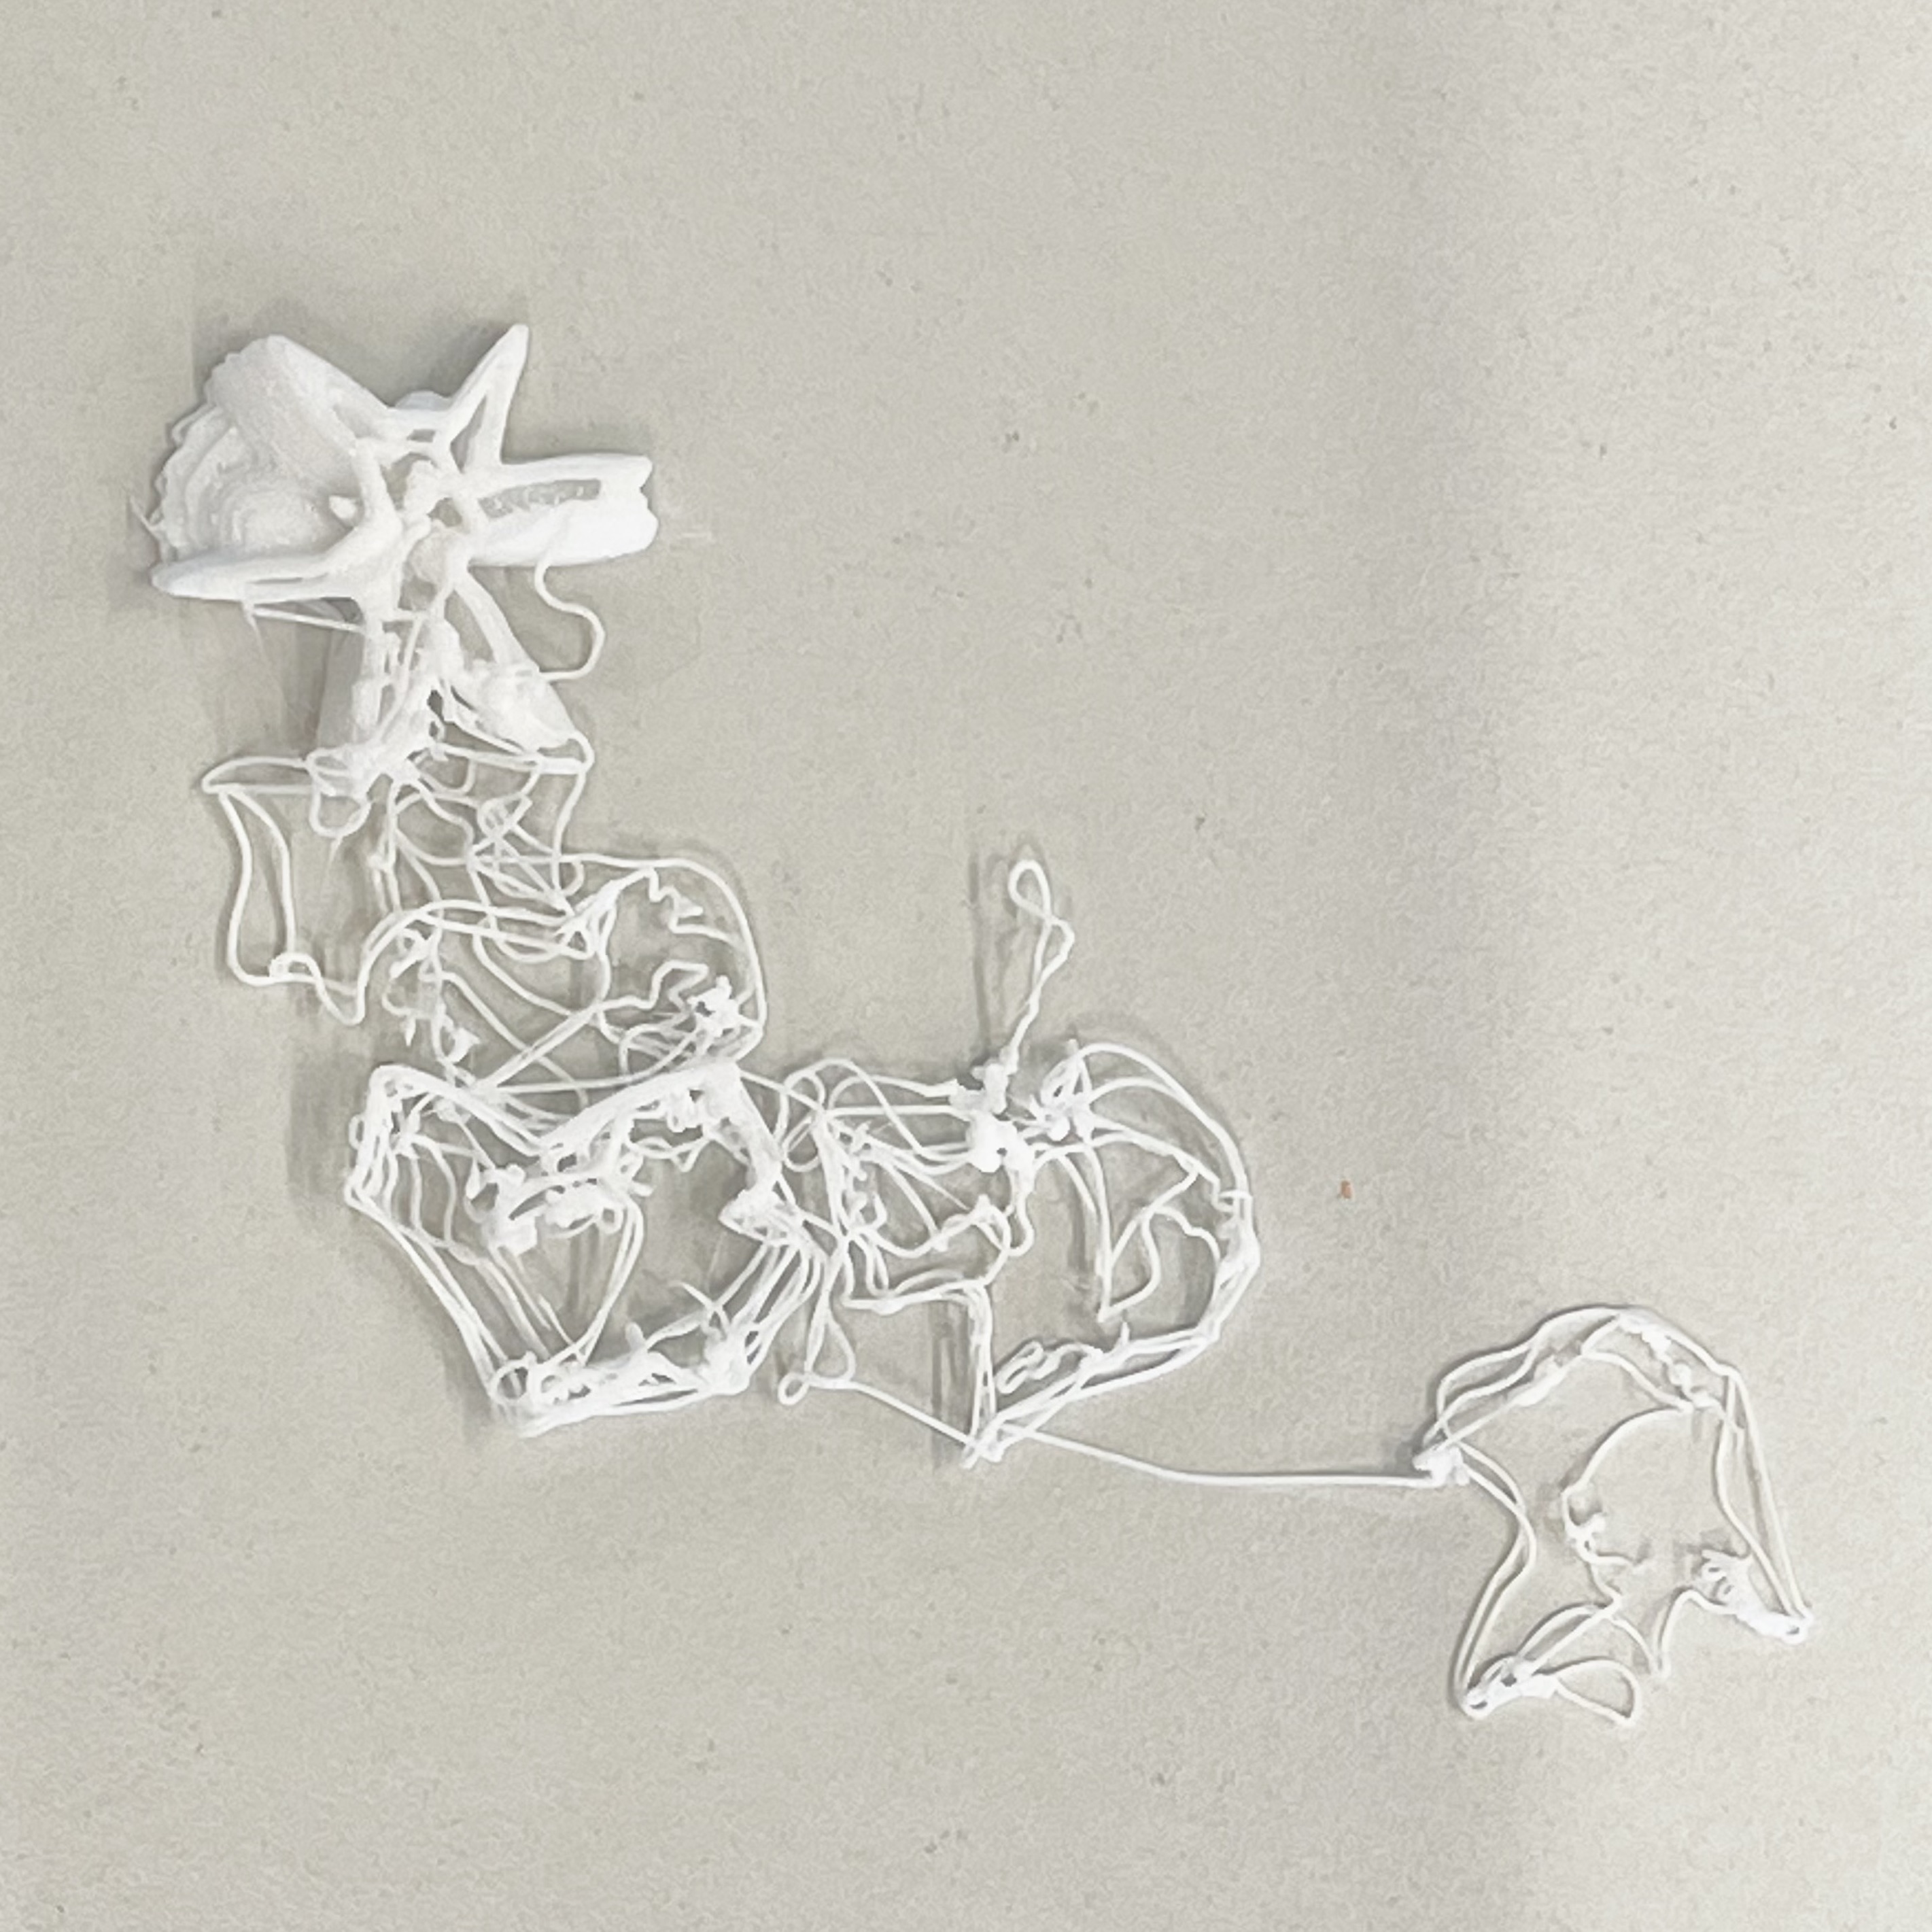
PRINTING
FAILURES
REFINEMENTS
RESOURCES
TOOLS


VOICES AS
PERSONALITIES
VOICES AS
PERSONALITIES
In this prototype, the vocal characteristics of users are utilised as a form of personal data to embody the intangibility of voices. As first impressions are often made of oneself by associating the voice we hear with an inferred persona. Where physical appearance serves as a visual representation of identities, similarly voices function as an audiovisual cue for one’s identity (Belin 2). This prototype draws attention to the analysis of voice samples as a basis for perceived voice personality.

Voices of users are captured through the computer’s microphone and transcribed onto an audio analysis deck to record and map out the data into a graph format. Acoustical measurements of the volume, pitch and frequency from the line graphs can assist in the identification of voice patterns within the samples.
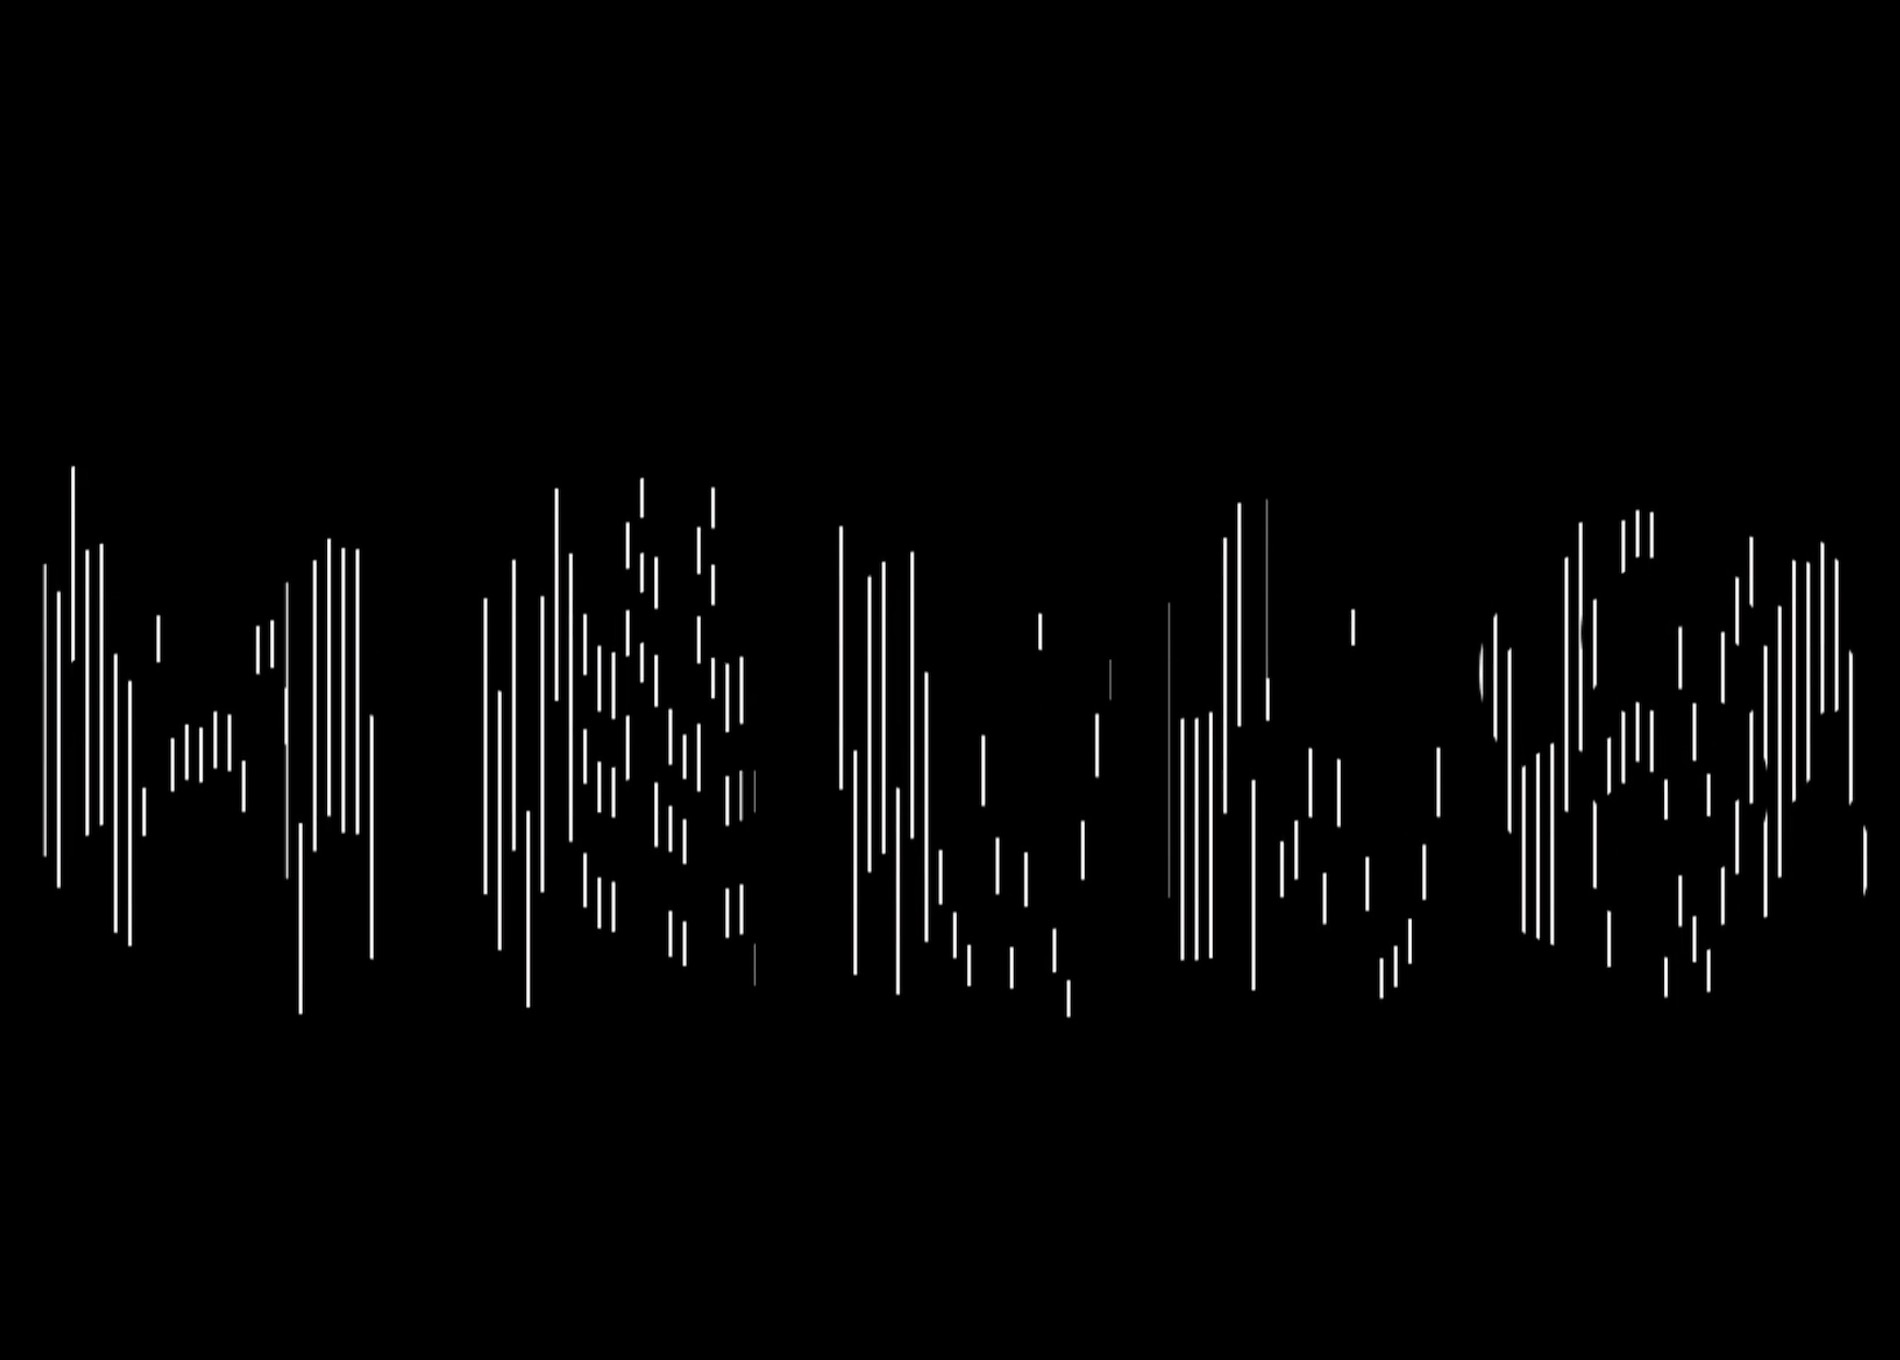
Voice frequencies were then analysed and mapped onto a visual noise generator, producing the outcomes as seen here. Vocal frequencies were separated into three channels, using colours as a way to visualise the differences in vocal pitch. The different colours used highlight the various vocal qualities present in the voice sample. As the sound of voices are unpredictable and cannot be controlled, the visual is fleeting, therefore the use of colours also aid in the visual recognition of the different in vocal frequencies. Through this visual outcome, vocal frequency patterns can be easily identified based on the prominence of the colours.
TYPOGRAPHIC EXPLORATIONS

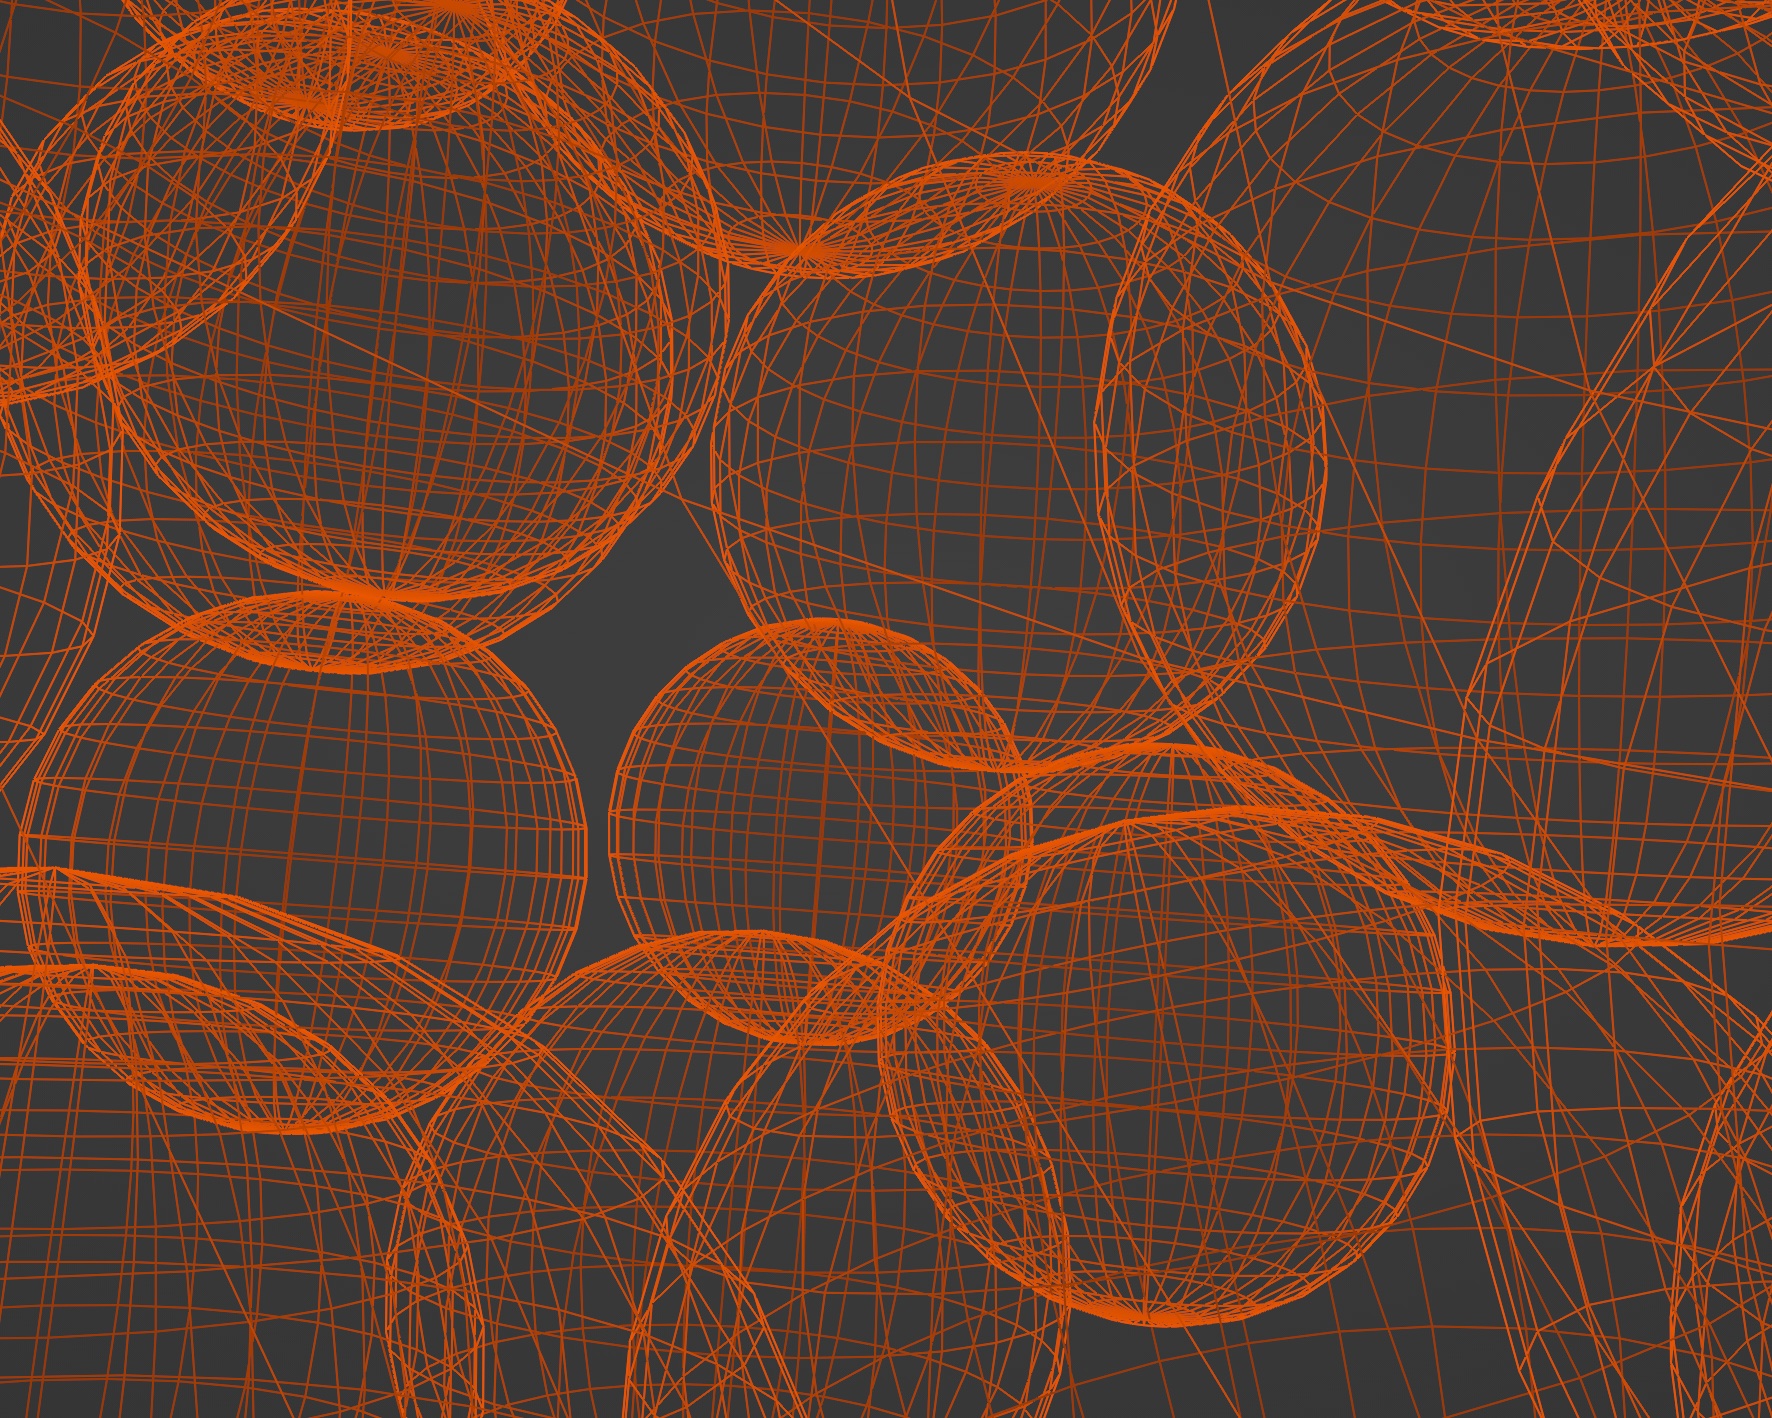
VOICE REACTIVE SHAPES
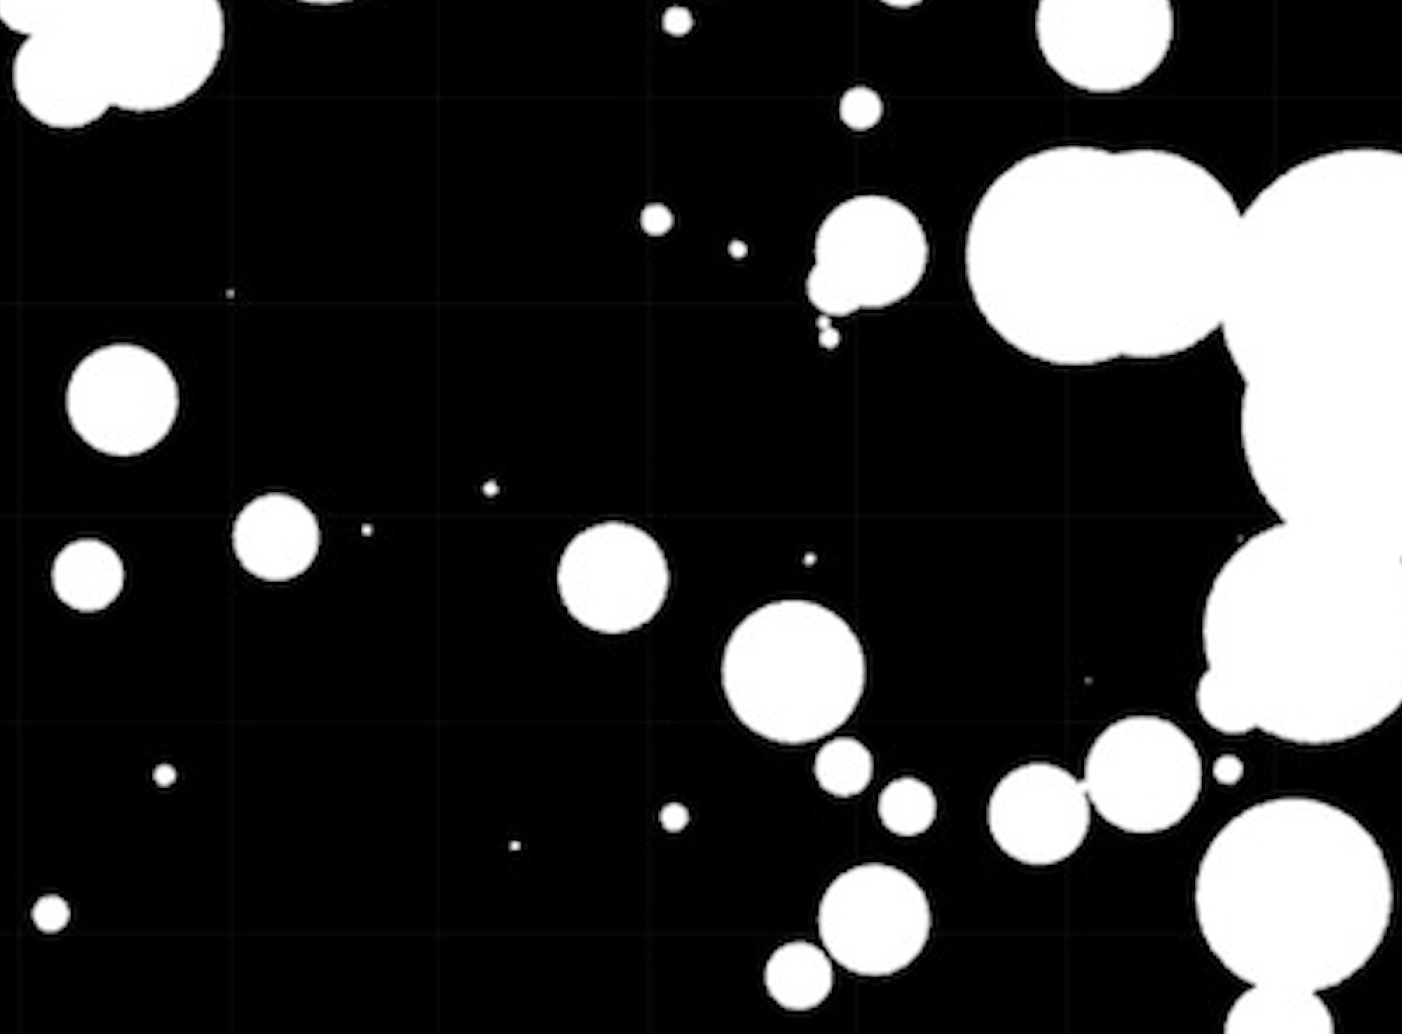
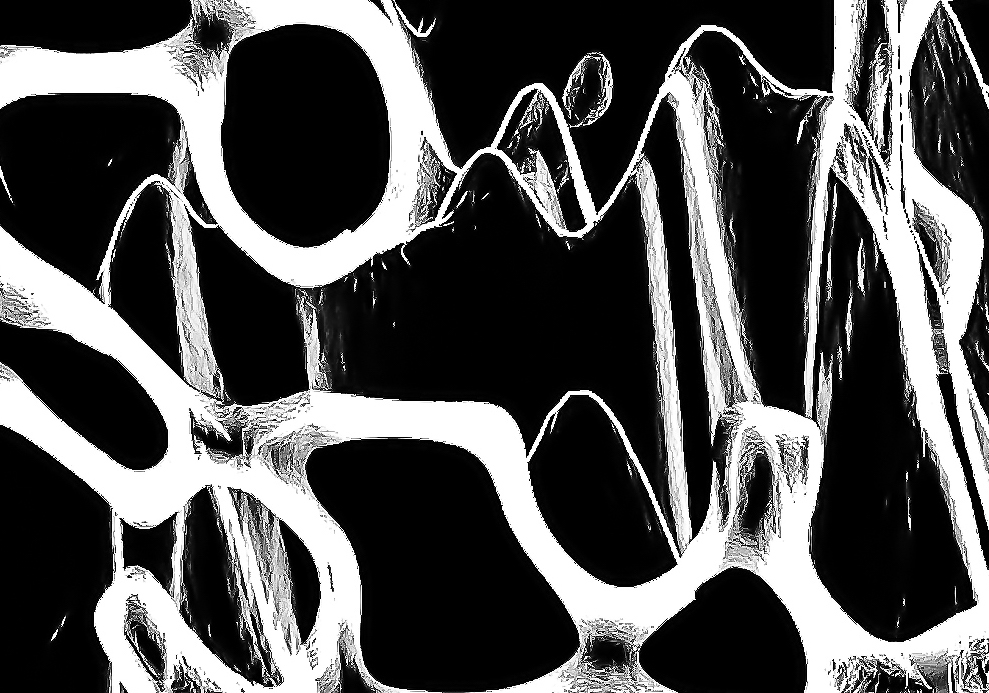
In the first attempt, vocal inputs are mapped to the scale, position and noise of the shapes. Upon receiving vocal input, the shapes transform from circles into noir pattern as the circles take on a noise effect. The shapes transform with every vocal input, creating a seamless and fluid evolution of patterns. This exploration embraces the generative nature of the shapeforms as it explores the voice reactivity interaction between users and the visual.
VOICE REACTIVE SLICED TYPOGRAPHY
The second visual exploration looks
into the mechanics of voice reactive typography–how vocal inputs can manipulate type and how letterforms
can be interacted with as a visual stimuli.
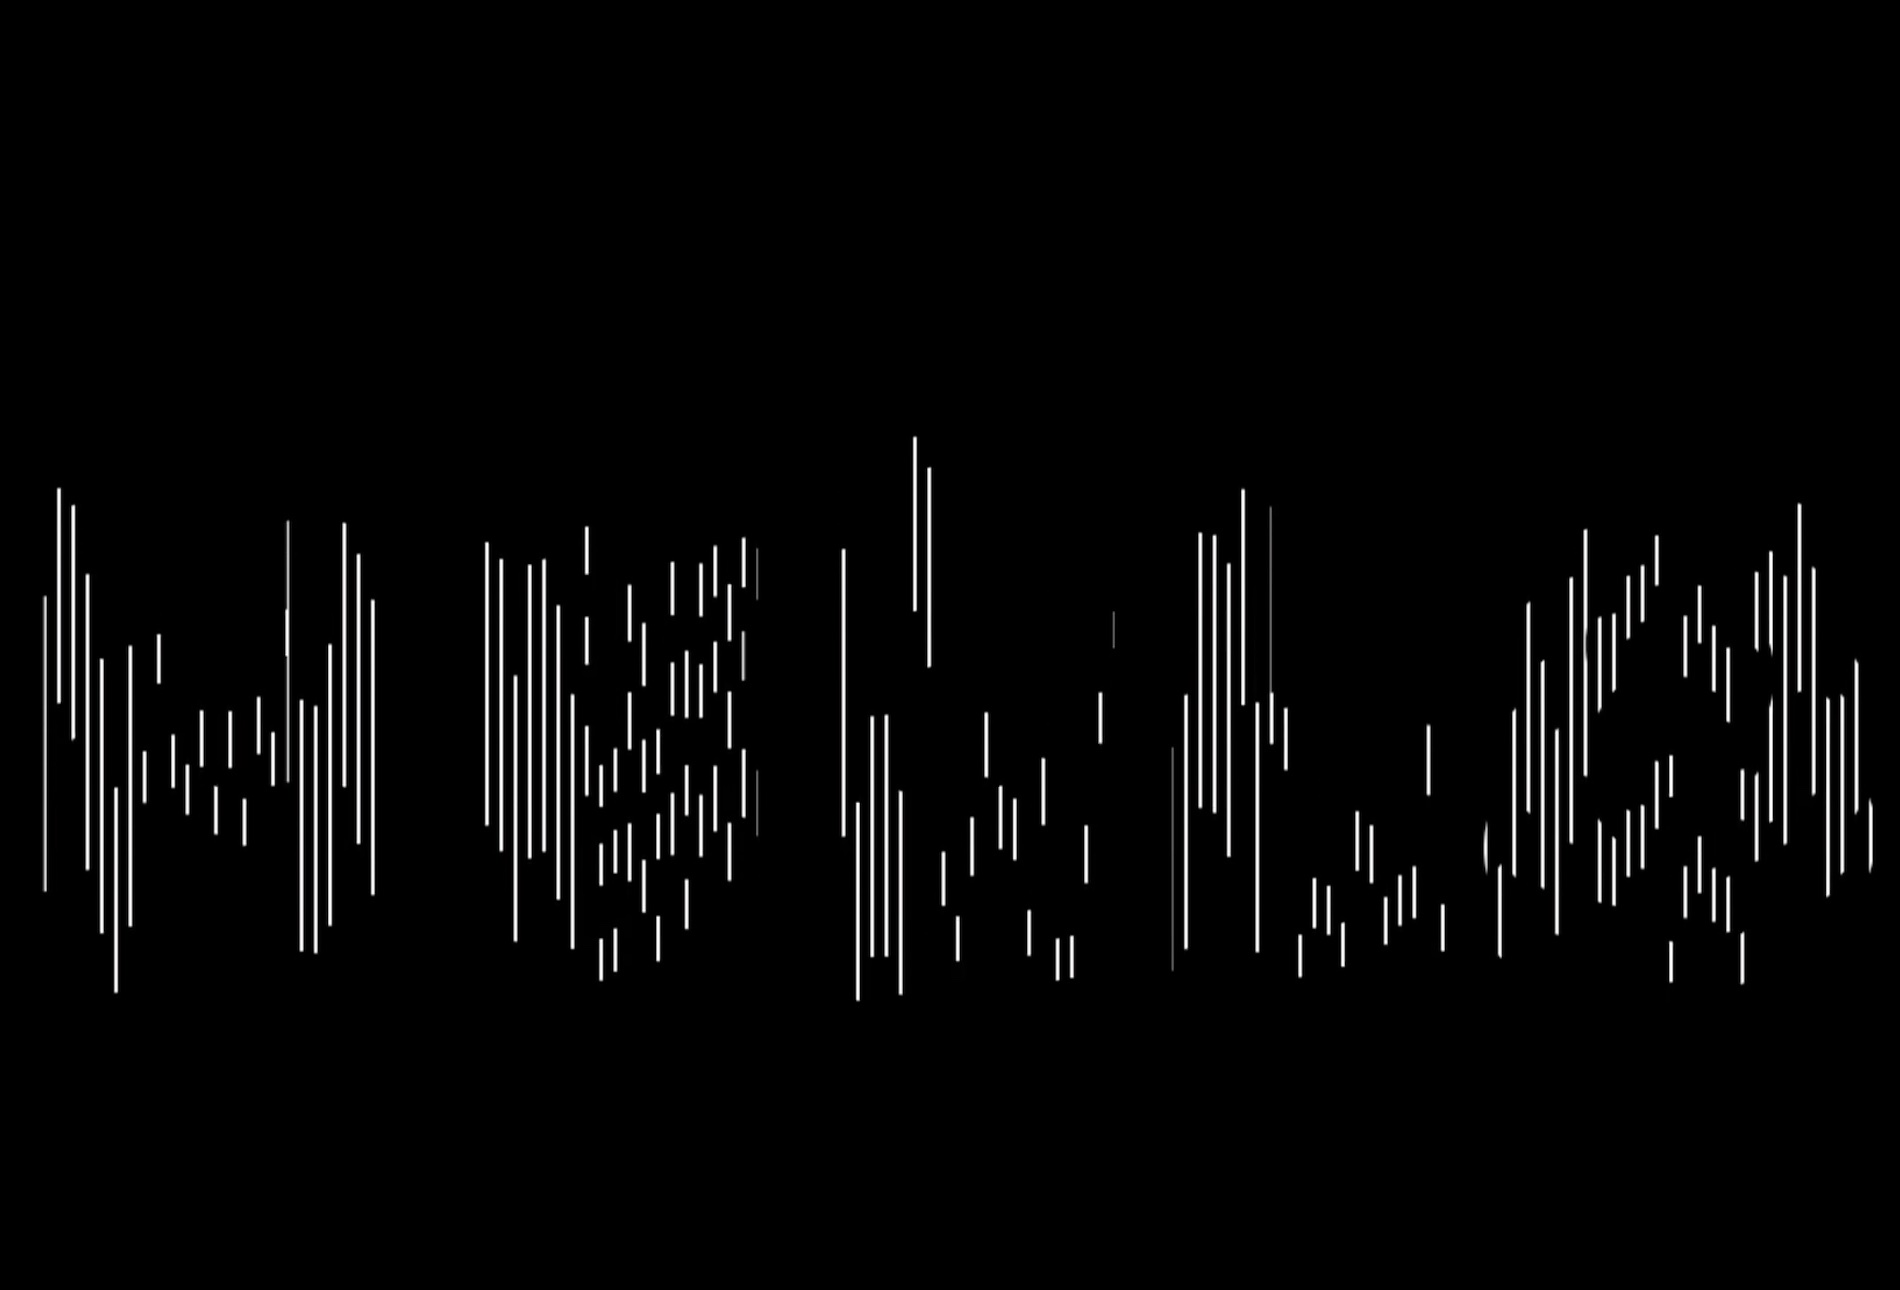
In this exploration, the typographic form is made up of slices that mimic the vocal frequency graph. In doing so, the vocal inputs are directly reflected in the typographic expression. Upon receiving the vocal inputs, the slices react by pulsing up in accordance with the volume, pitch and frequency of the voice. The higher the vocal pitch and frequency, the more the slices move away from one another.


3D + LETTERFORMS
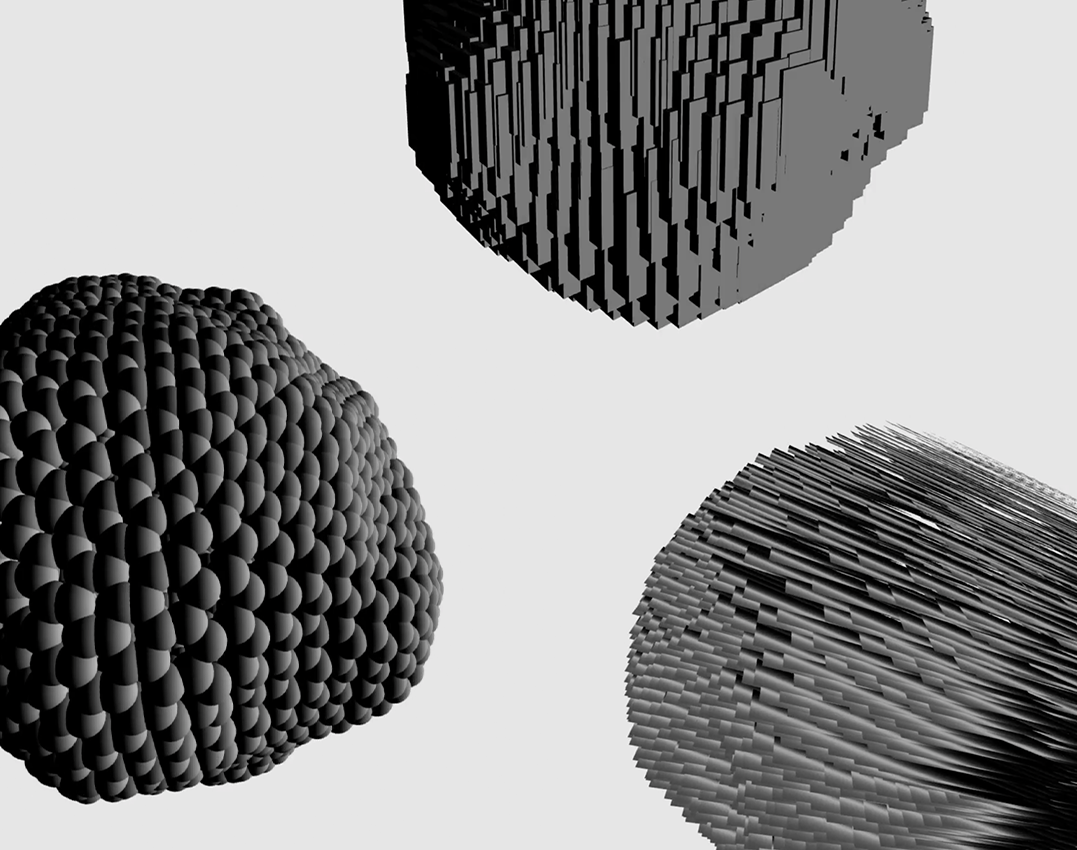
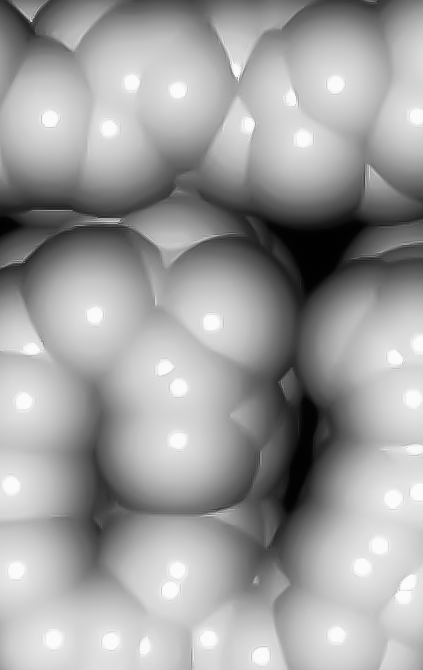
The third exploration visualises typographic forms through the use of 3-dimensional shapes. Vocal traits are mapped onto different shape states that interchange according to the volume and pitch of our voices.
Four typographic states were experimented with, namely spheres, cubes, noise and outlines. Vocal input here controls the change in the typographic state being displayed. The typographic states are mapped on a linear scale, with increasing vocal pitch and volume, the typographic state will appear if the value reaches a certain vocal range. Different types of shape forms were also utilised to produce contrasting typographic states. 3D shapes were used to make up the letterform to portray voice in a dynamic and almost tangible way.
SHAPES + LETTERFORMS
In the fourth exploration, typographic treatments that feature noise distortions are systematically indexed at different trigger values such that the various typographic state is generated accordingly when the audio input reaches a specific level.
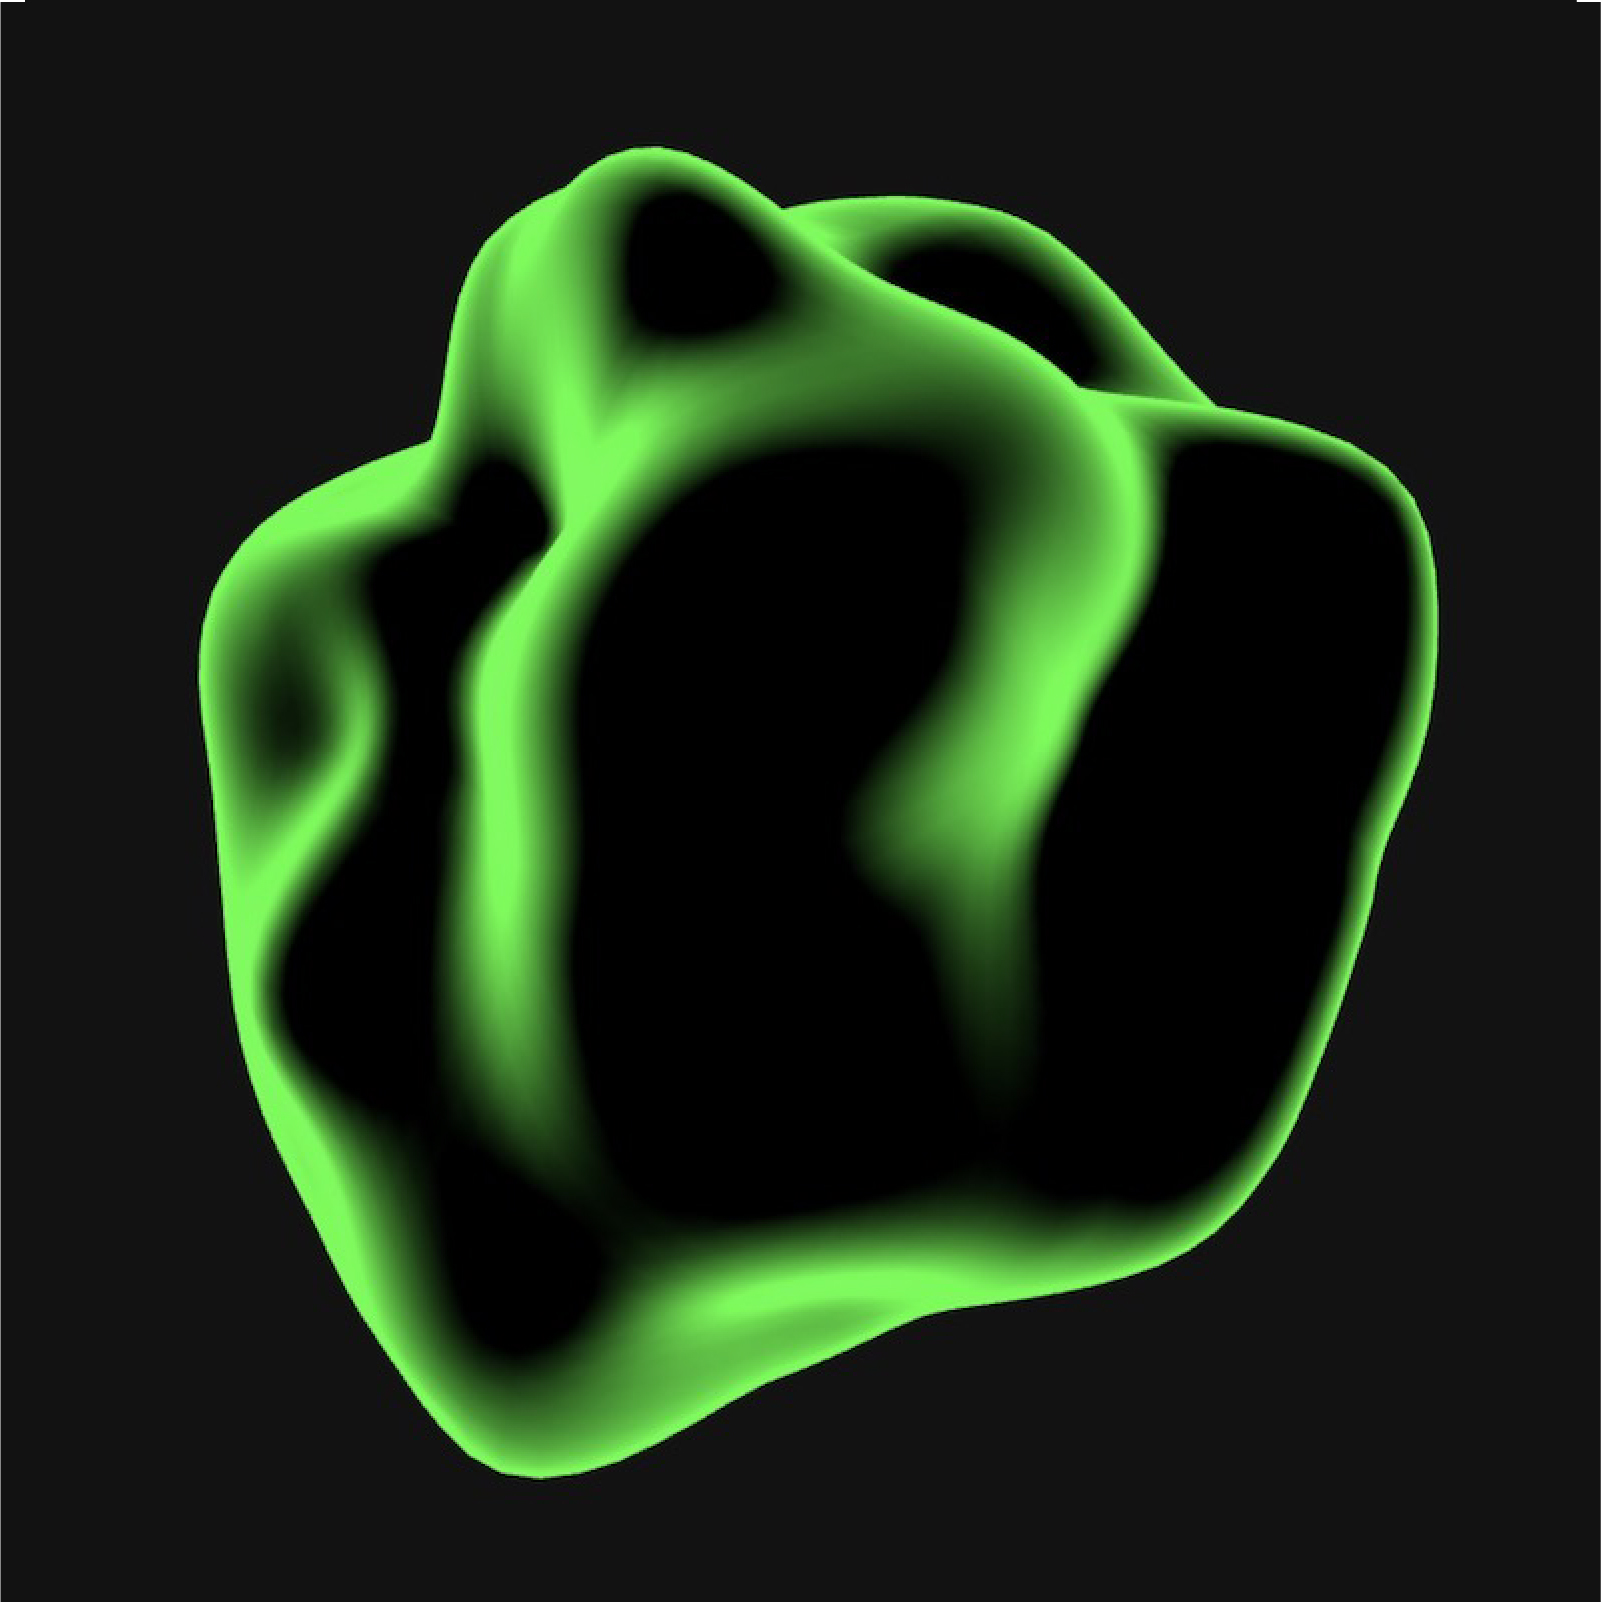
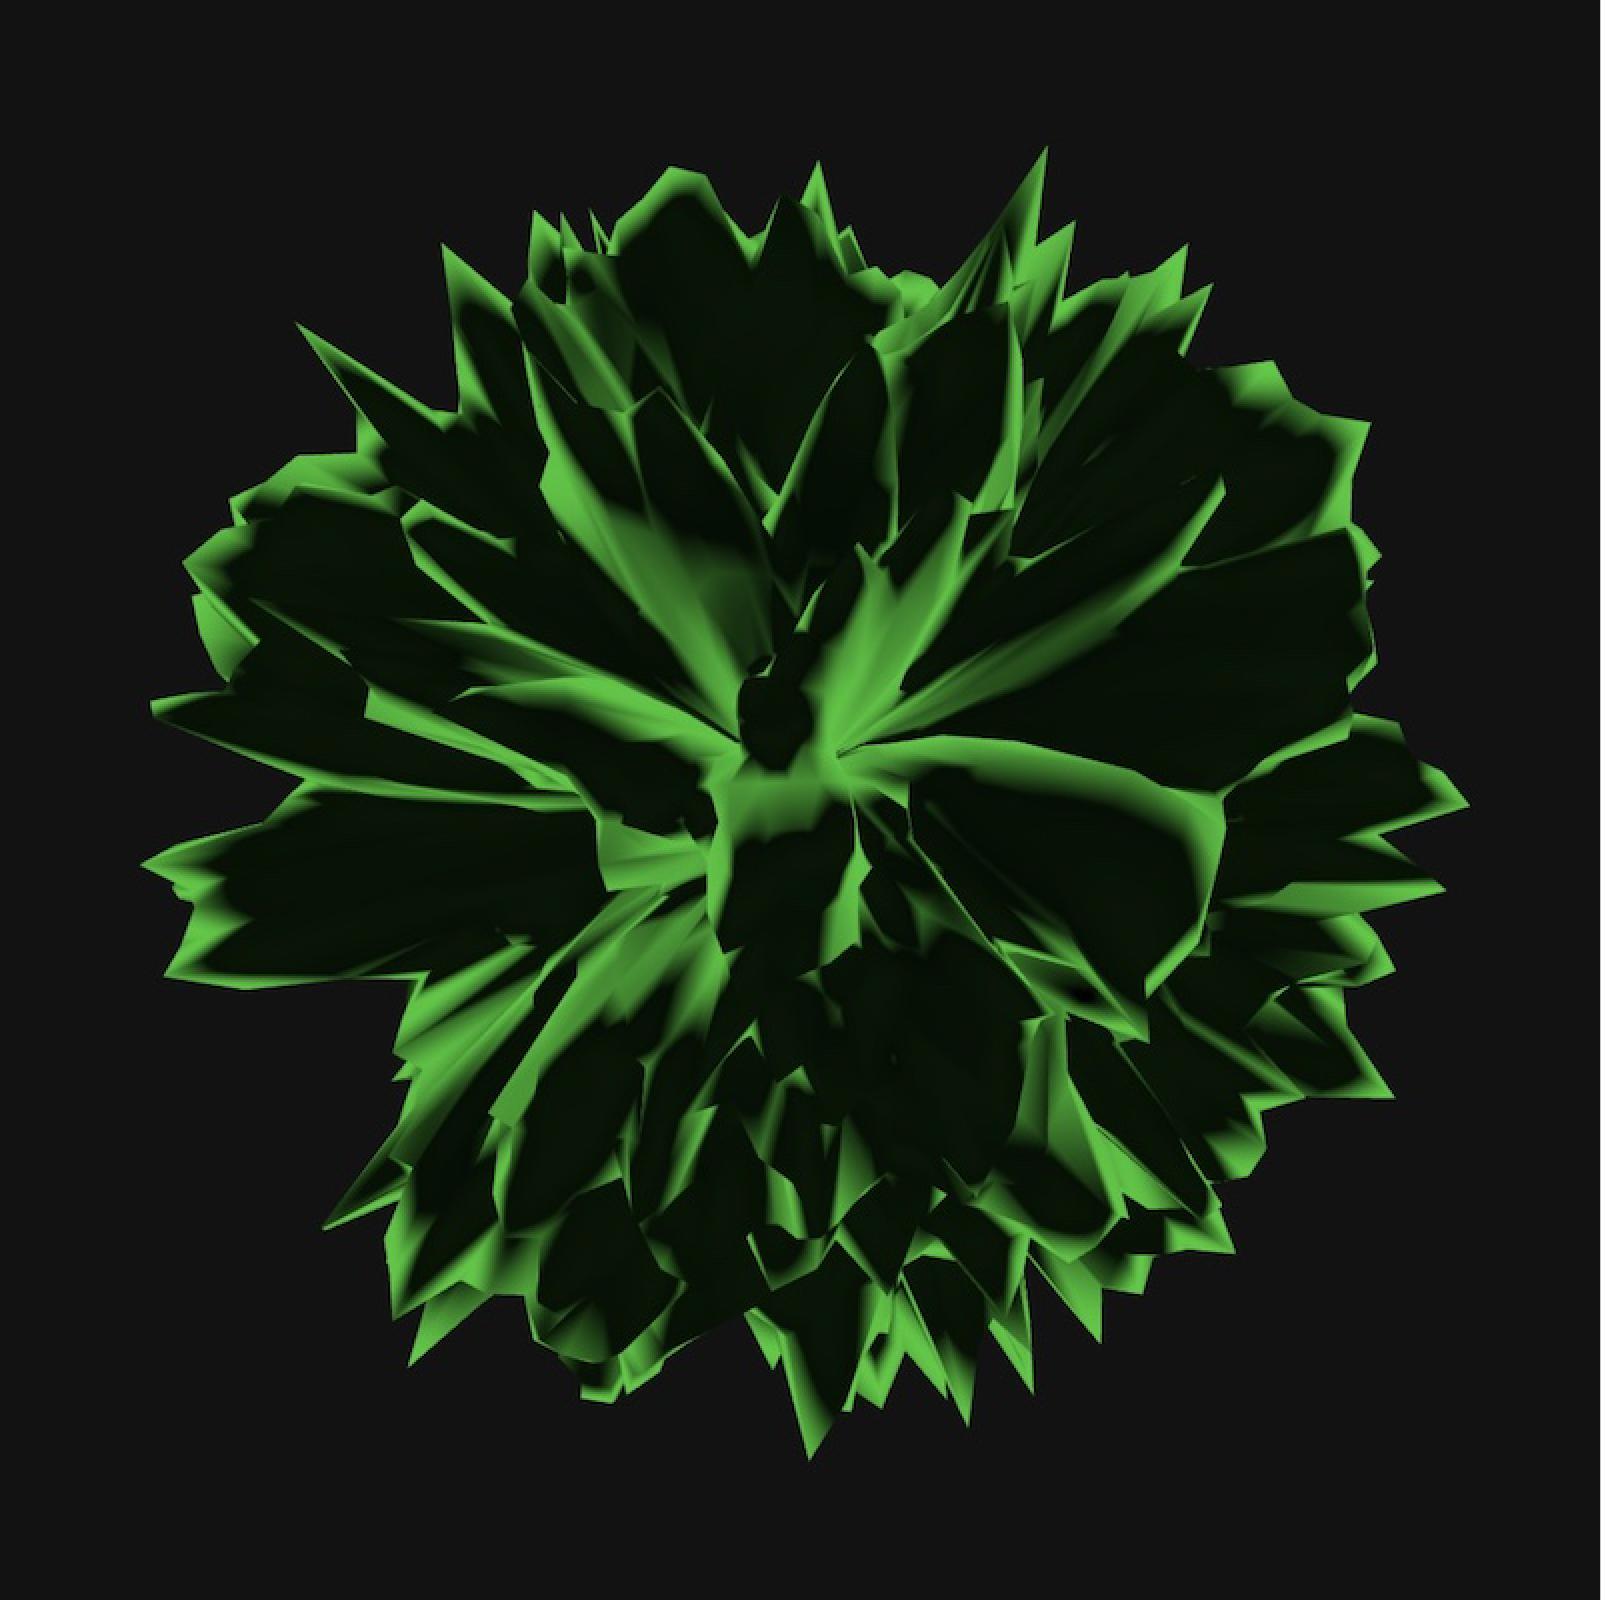
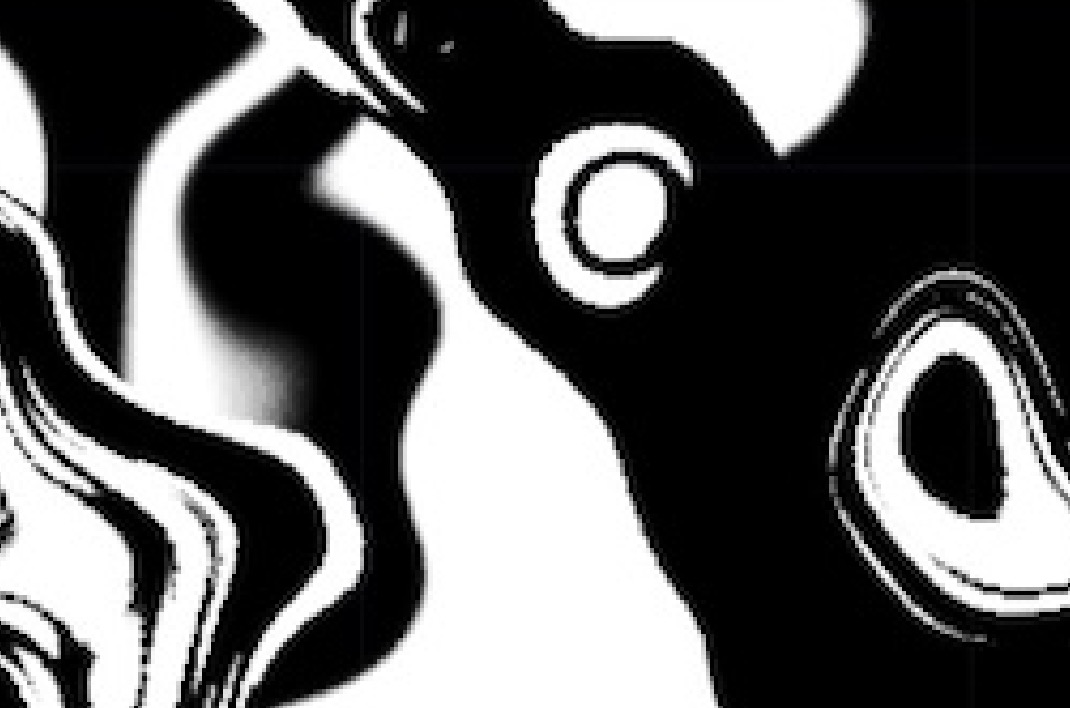
An extension to the third exploration–the fourth exploration looks at typographic forms in a 2-dimensional state. Using noise to manipulate the typography, the different amplitudes and exponents of noise can create differing typographic distortions. Typographic states are differentiated based on their distortions. A noisy typographic state as seen in Figure O, or an angular typographic state like Figure P, or a fluid and organic typographic state like Figure Q can connote various personality traits or even allude to different personas based on the appearance and behaviour of the typographic state.

NOISE + LETTERFORMS
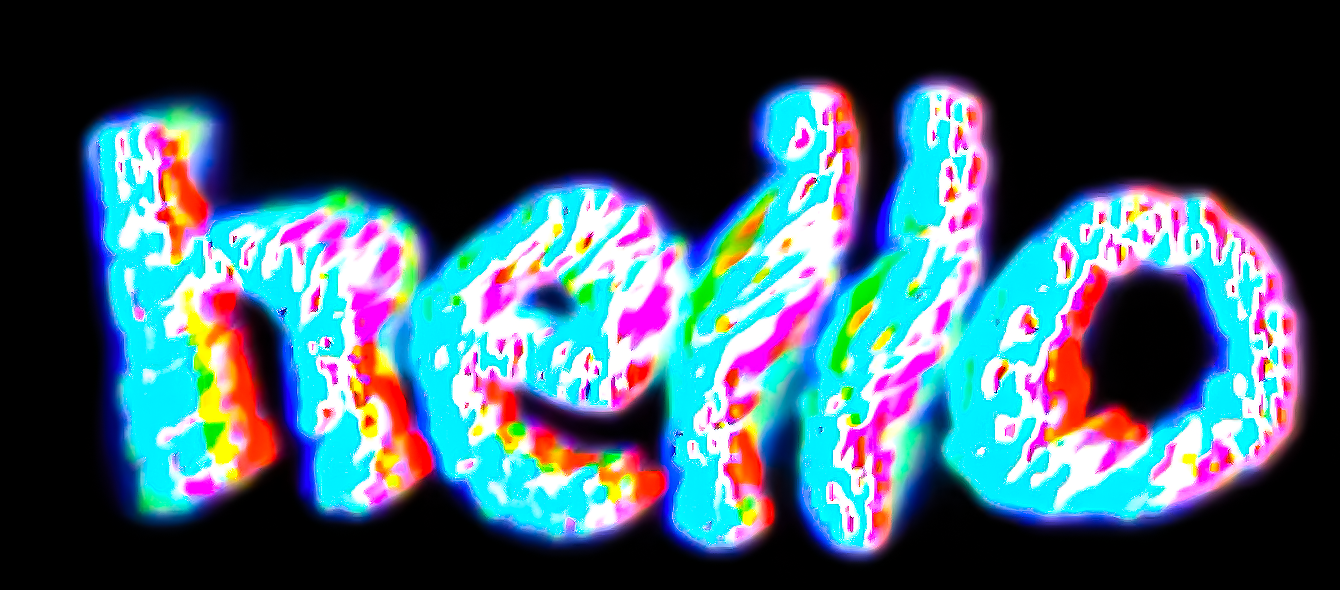
In the fifth exploration, noise was utilised to distort the typographic letterform. Similarly to previous explorations, different noise states were indexed at specific value range which interchanges acccordingly upon receiving vocal inputs.
NOISE + LETTERFORMS
In the fifth exploration, noise was utilised to distort the typographic letterform. Similarly to previous explorations, different noise states were indexed at specific value range which interchanges acccordingly upon receiving vocal inputs.
INTERACTIVE MODES
Different applications of interactivity were also explored. Starting off with a field input prototype to enable users to type out their inputs as a way of communicating their words into text format that can be received and displayed on screen. However, this application was not ideal as it did not fit the concept of exploring personalities through our voices, rather the interaction or data input process is void of any vocal element which may hinder the data analysis aspect of the program. In addition, the act of typing was too similar to the Affective Data Objects' interaction, haing clashing modes of interaction may create confusion amongst prototypes.
SPEECH-TO-TEXT EXPERIMENTS
Other languages were also experimented with the Speech-To-Text algorithm. By changing the language input to the specific language codes, spoken words in the selected language can be recognised and transposed into text. In this example demo, Simplified Chinese characters are being manipulated according to the user's voice.

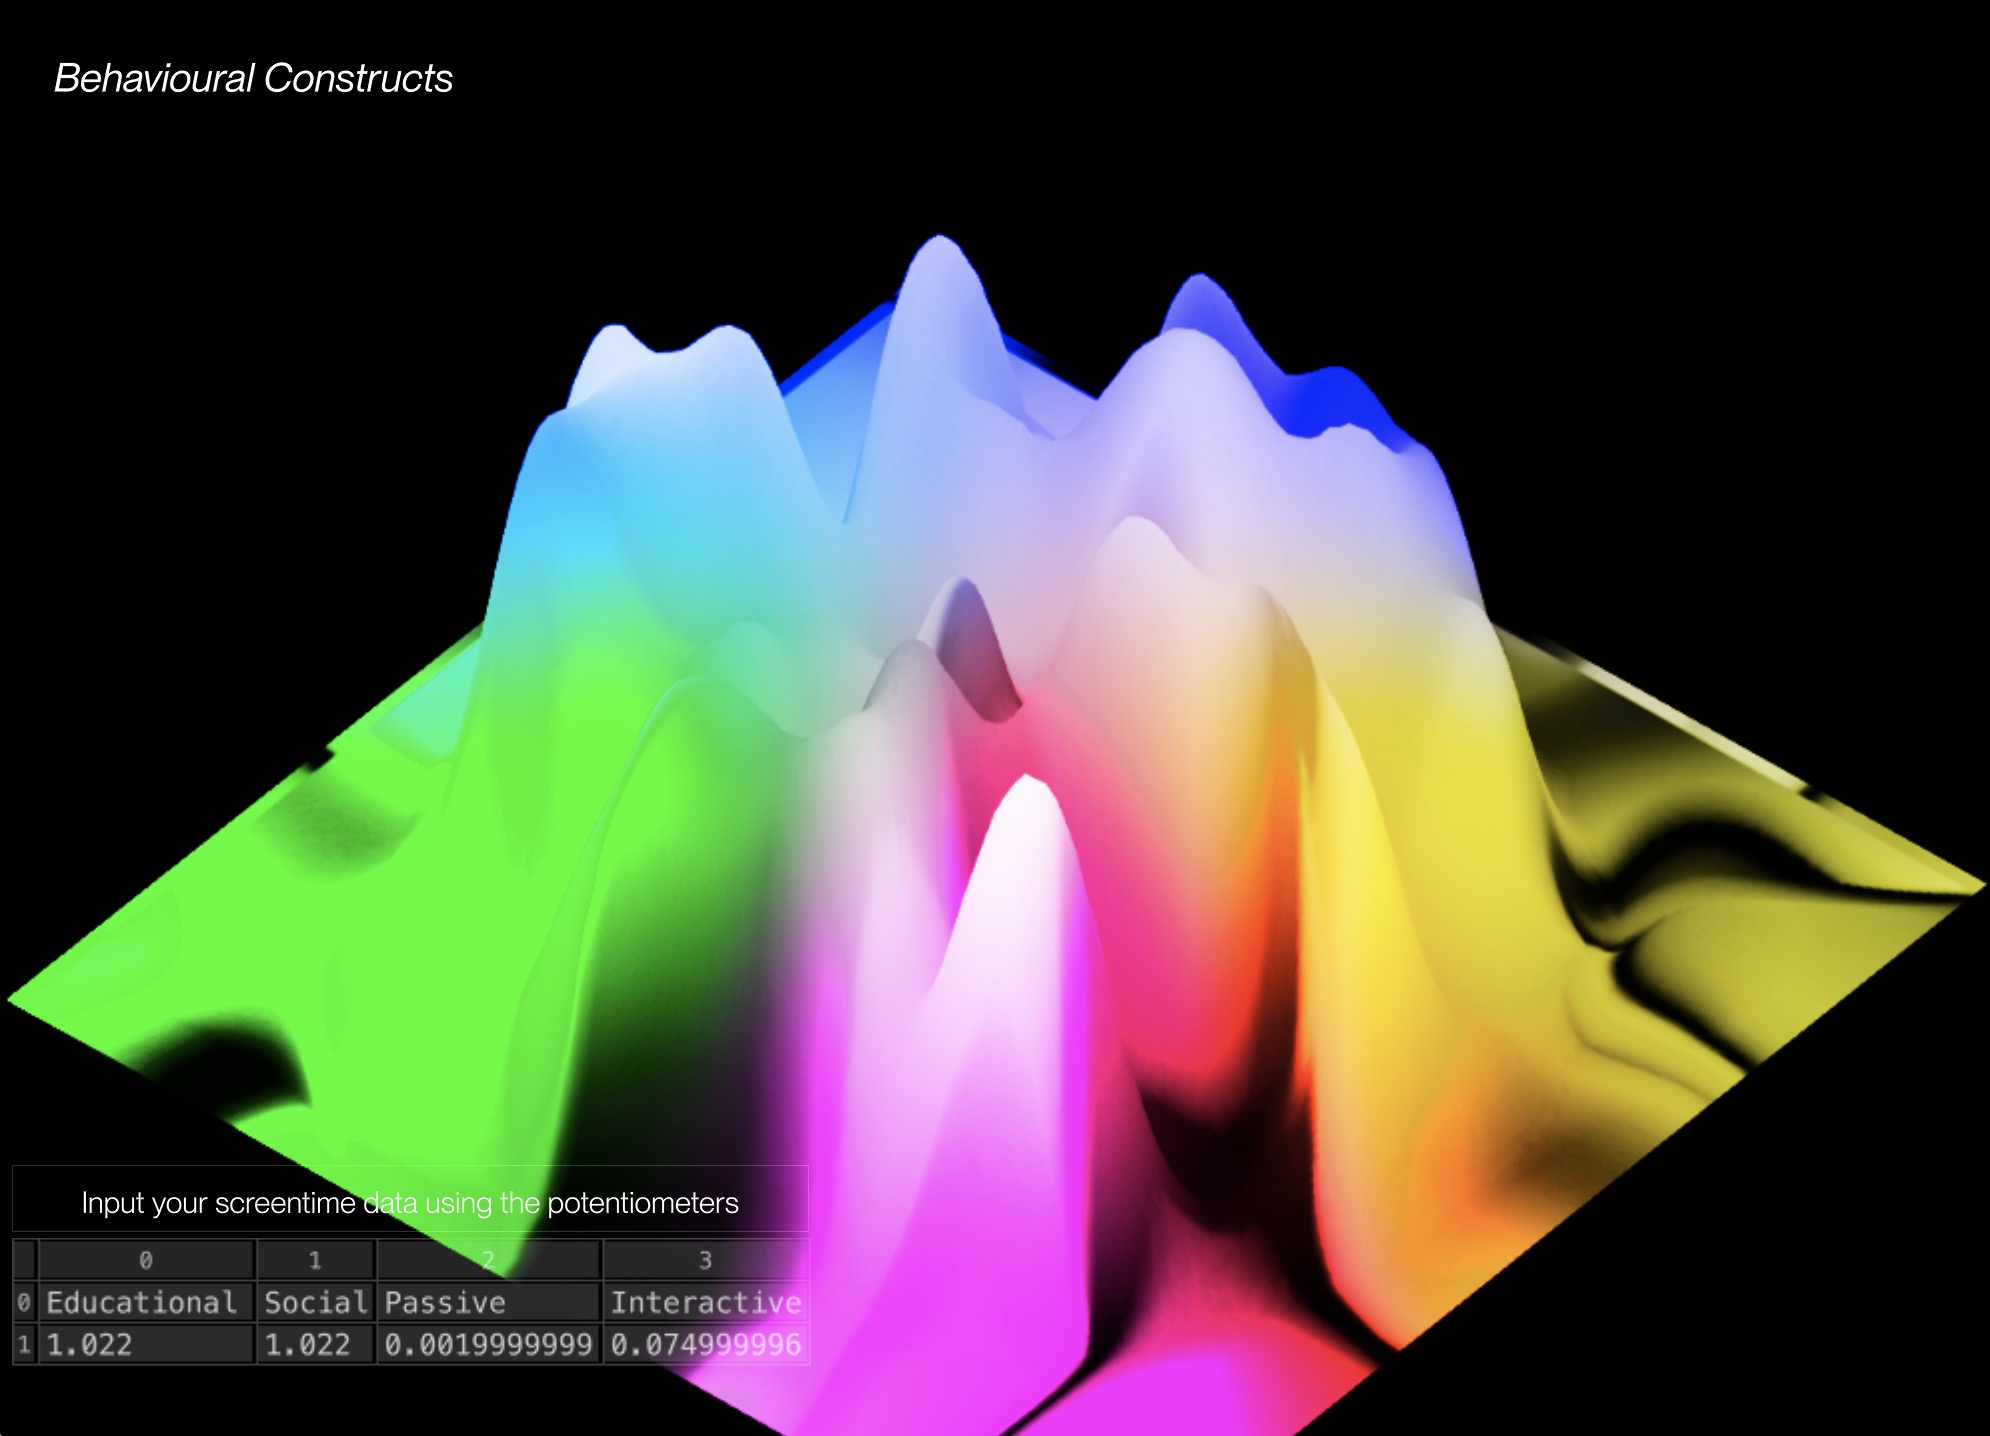
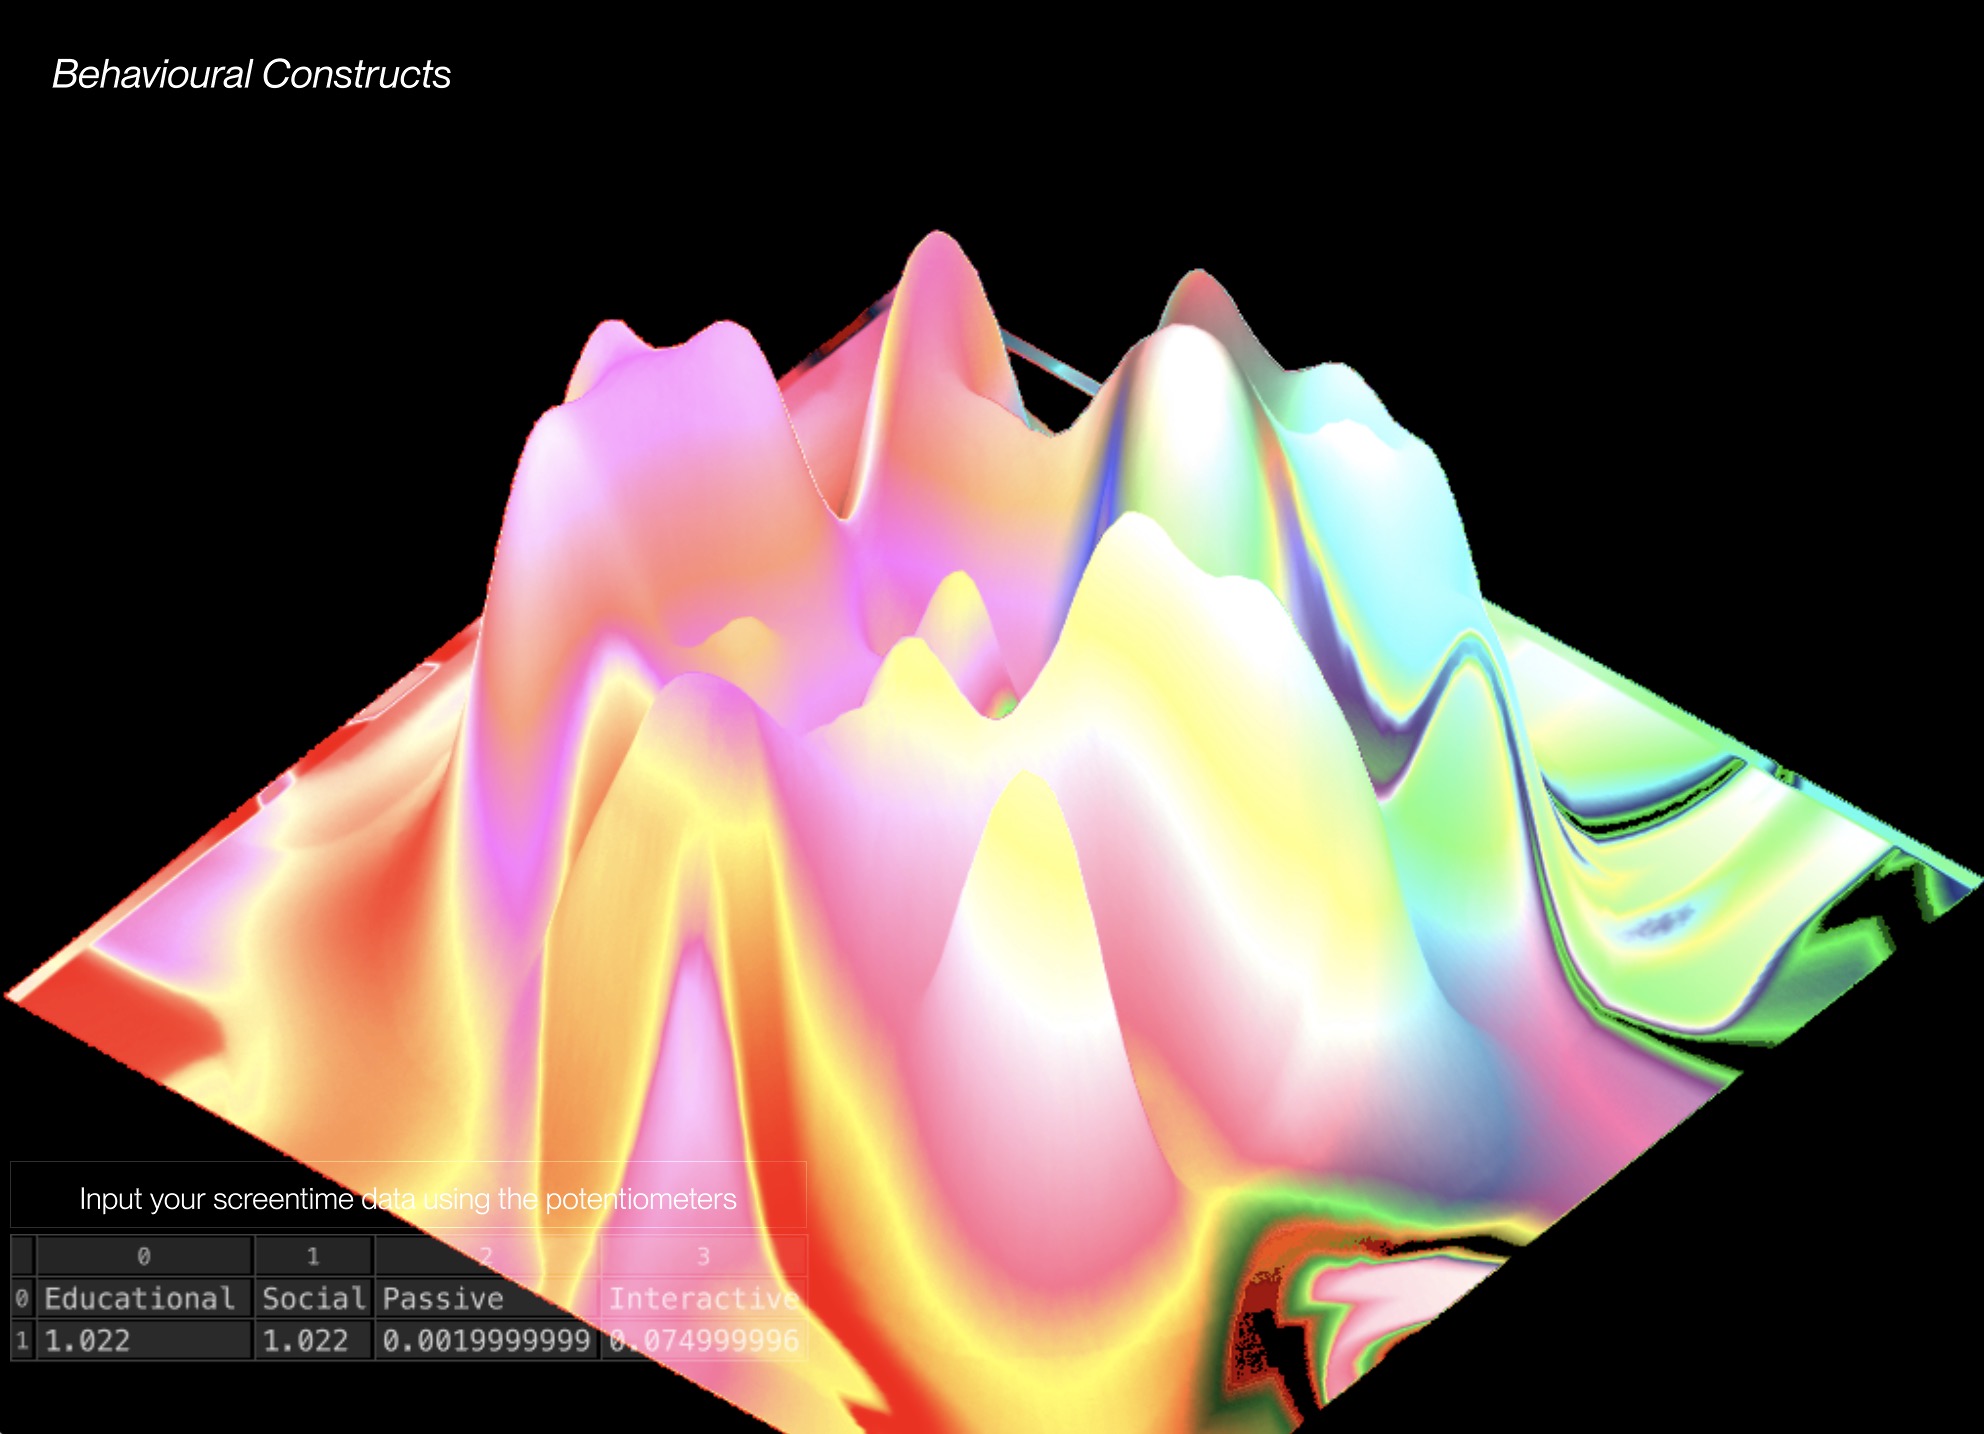
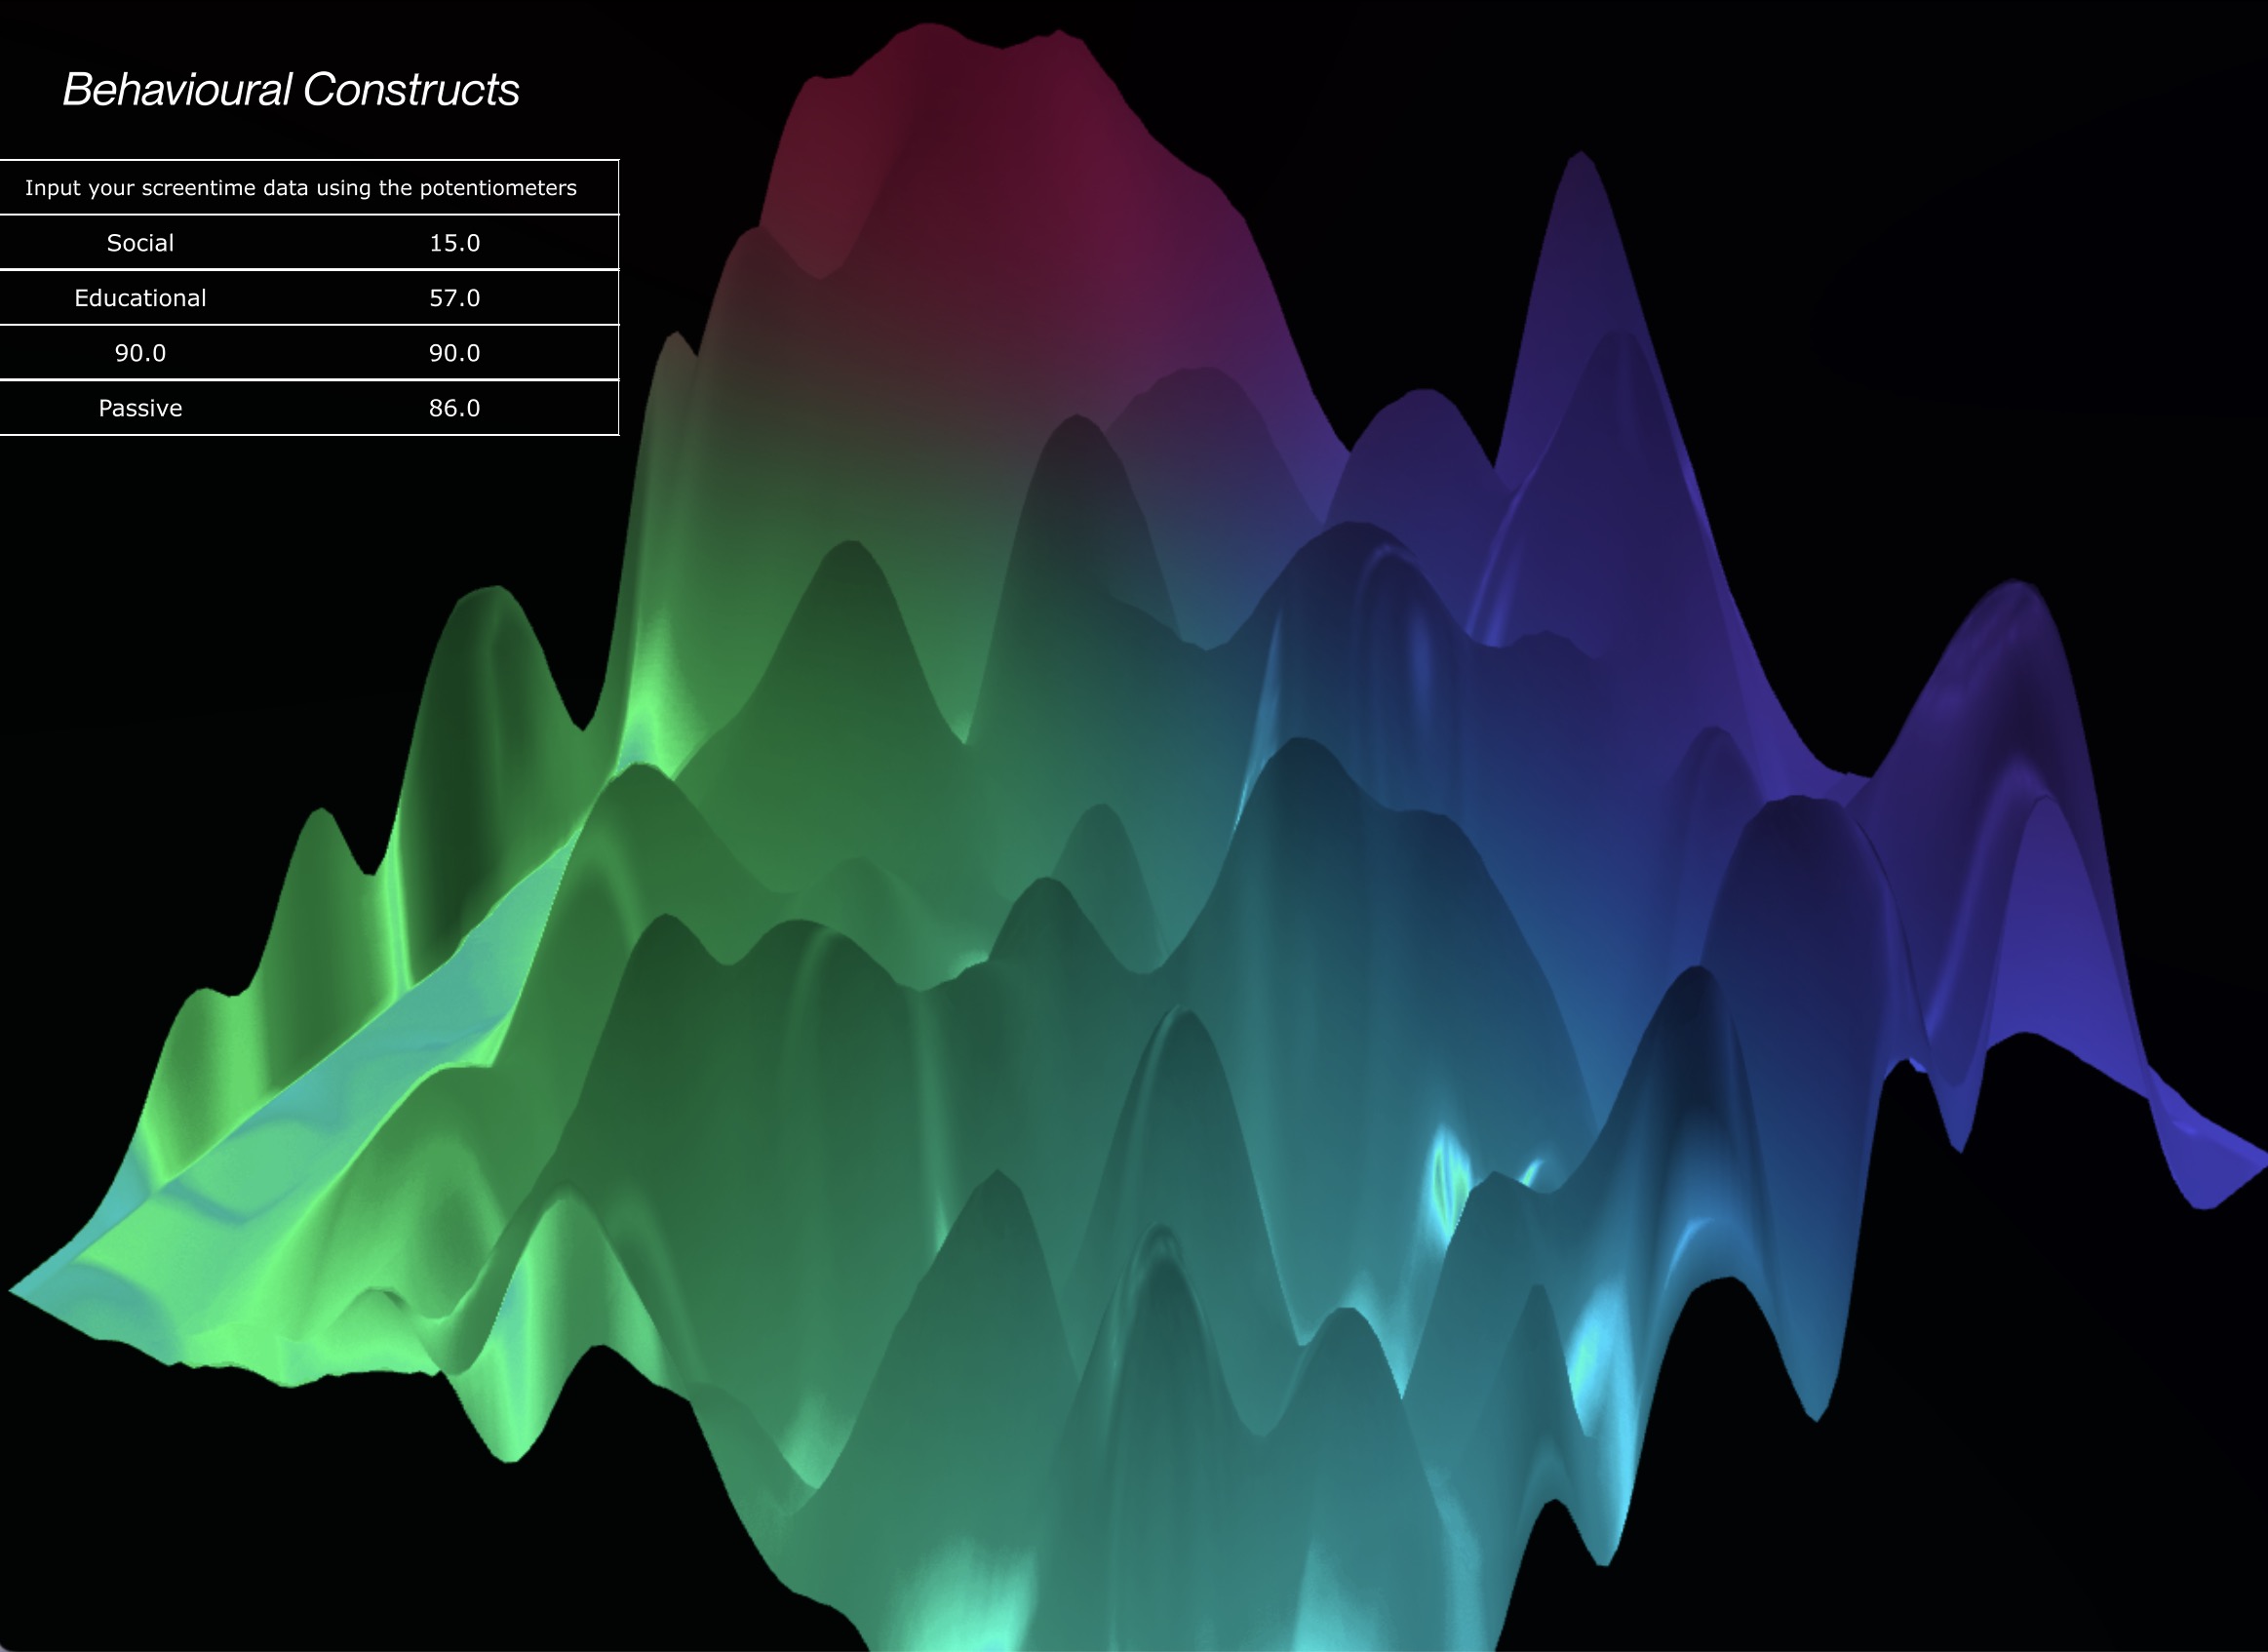
BEHAVIOURAL CONSTRUCTS
BEHAVIOURAL CONSTRUCTS
Voice frequencies were then analysed and mapped onto a visual noise generator, producing the outcomes as seen here. Vocal frequencies were separated into three channels, using colours as a way to visualise the differences in vocal pitch. The different colours used highlight the various vocal qualities present in the voice sample. As the sound of voices are unpredictable and cannot be controlled, the visual is fleeting, therefore the use of colours also aid in the visual recognition of the different in vocal frequencies. Through this visual outcome, vocal frequency patterns can be easily identified based on the prominence of the colours.


CODED EXPERIMENTS
Visual approaches include a combination of P5.JS & Touchdesigner explorations. First, the digital visualisations leveraged on computing power to generate the Behavioural Constructs.
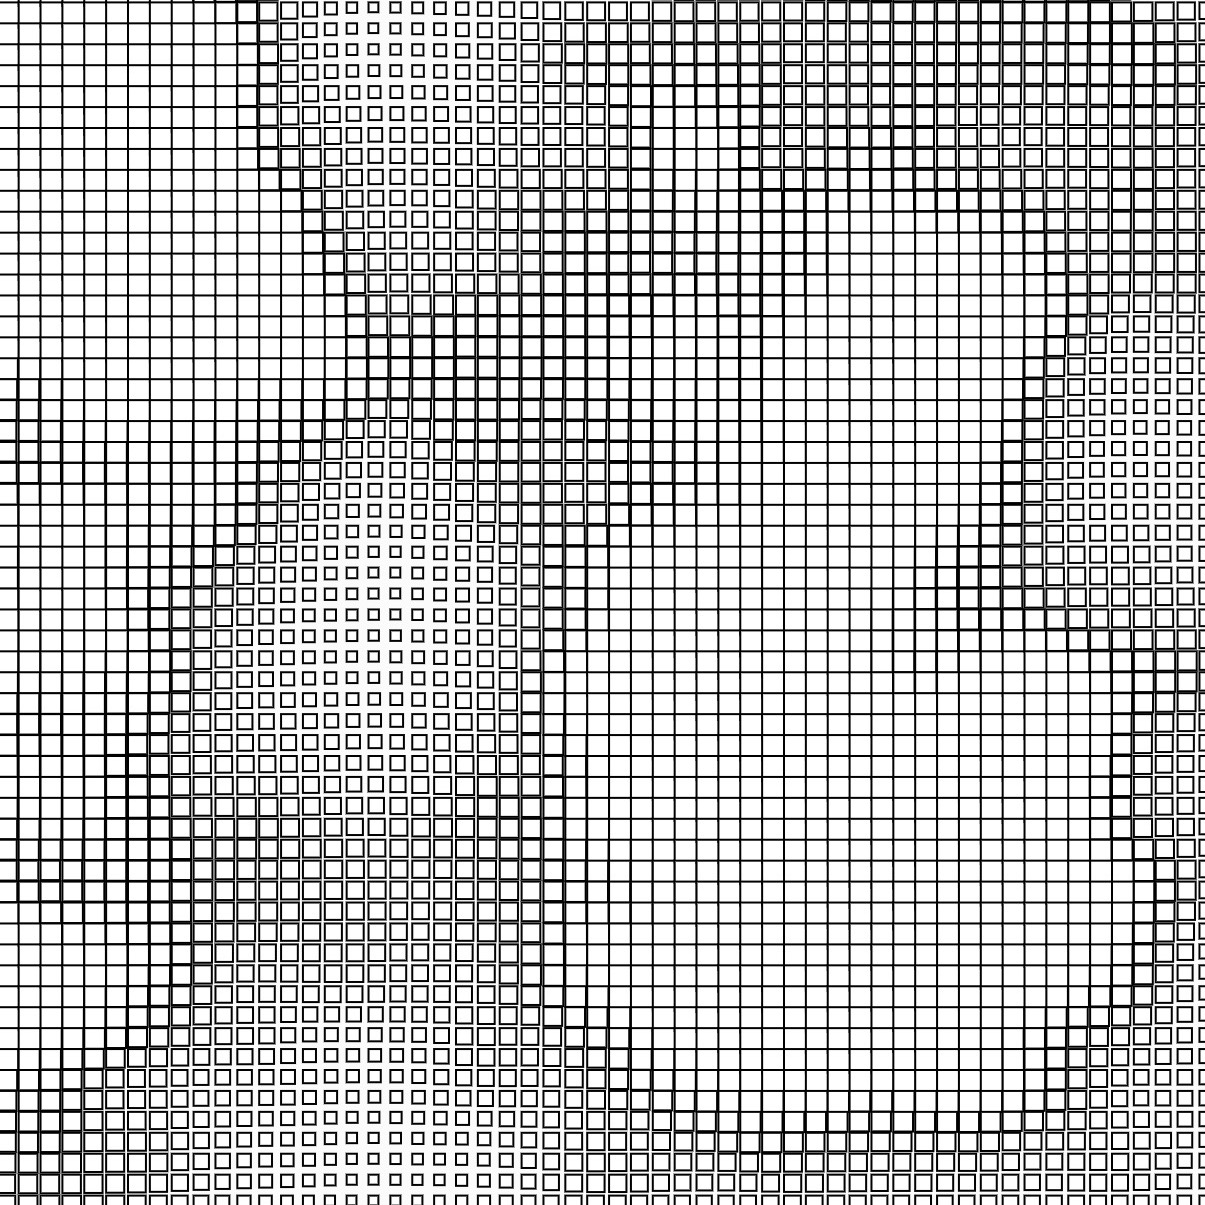
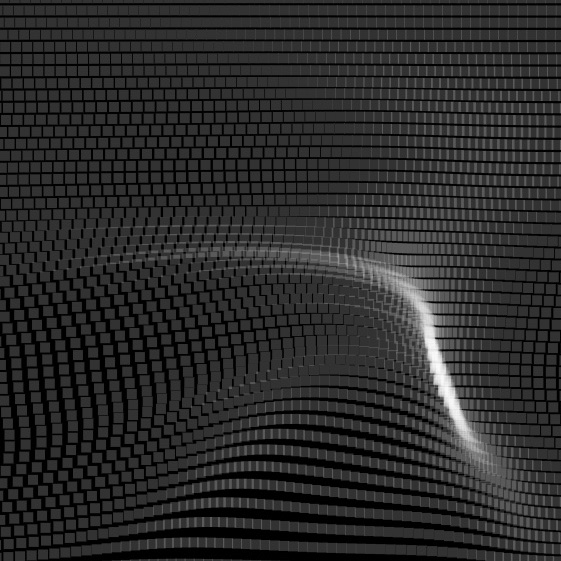
Coded experiments utilised P5.JS, a web editor, to generate the distortions onto a grid. This approach was efficient but also lacking in terms of the designer’s control of the scale, convexity and positioning of distortions. This application was mainly considered due to its ability to create interactive programs that can engage users in the creation of screentime visualisations. However, the design process of generative visuals come with limitations depending on the designer’s programming capabilities. After experimenting with several methods and techniques using code as a means to generate screentime data, visual explorations have taken a change towards Touchdesigner.
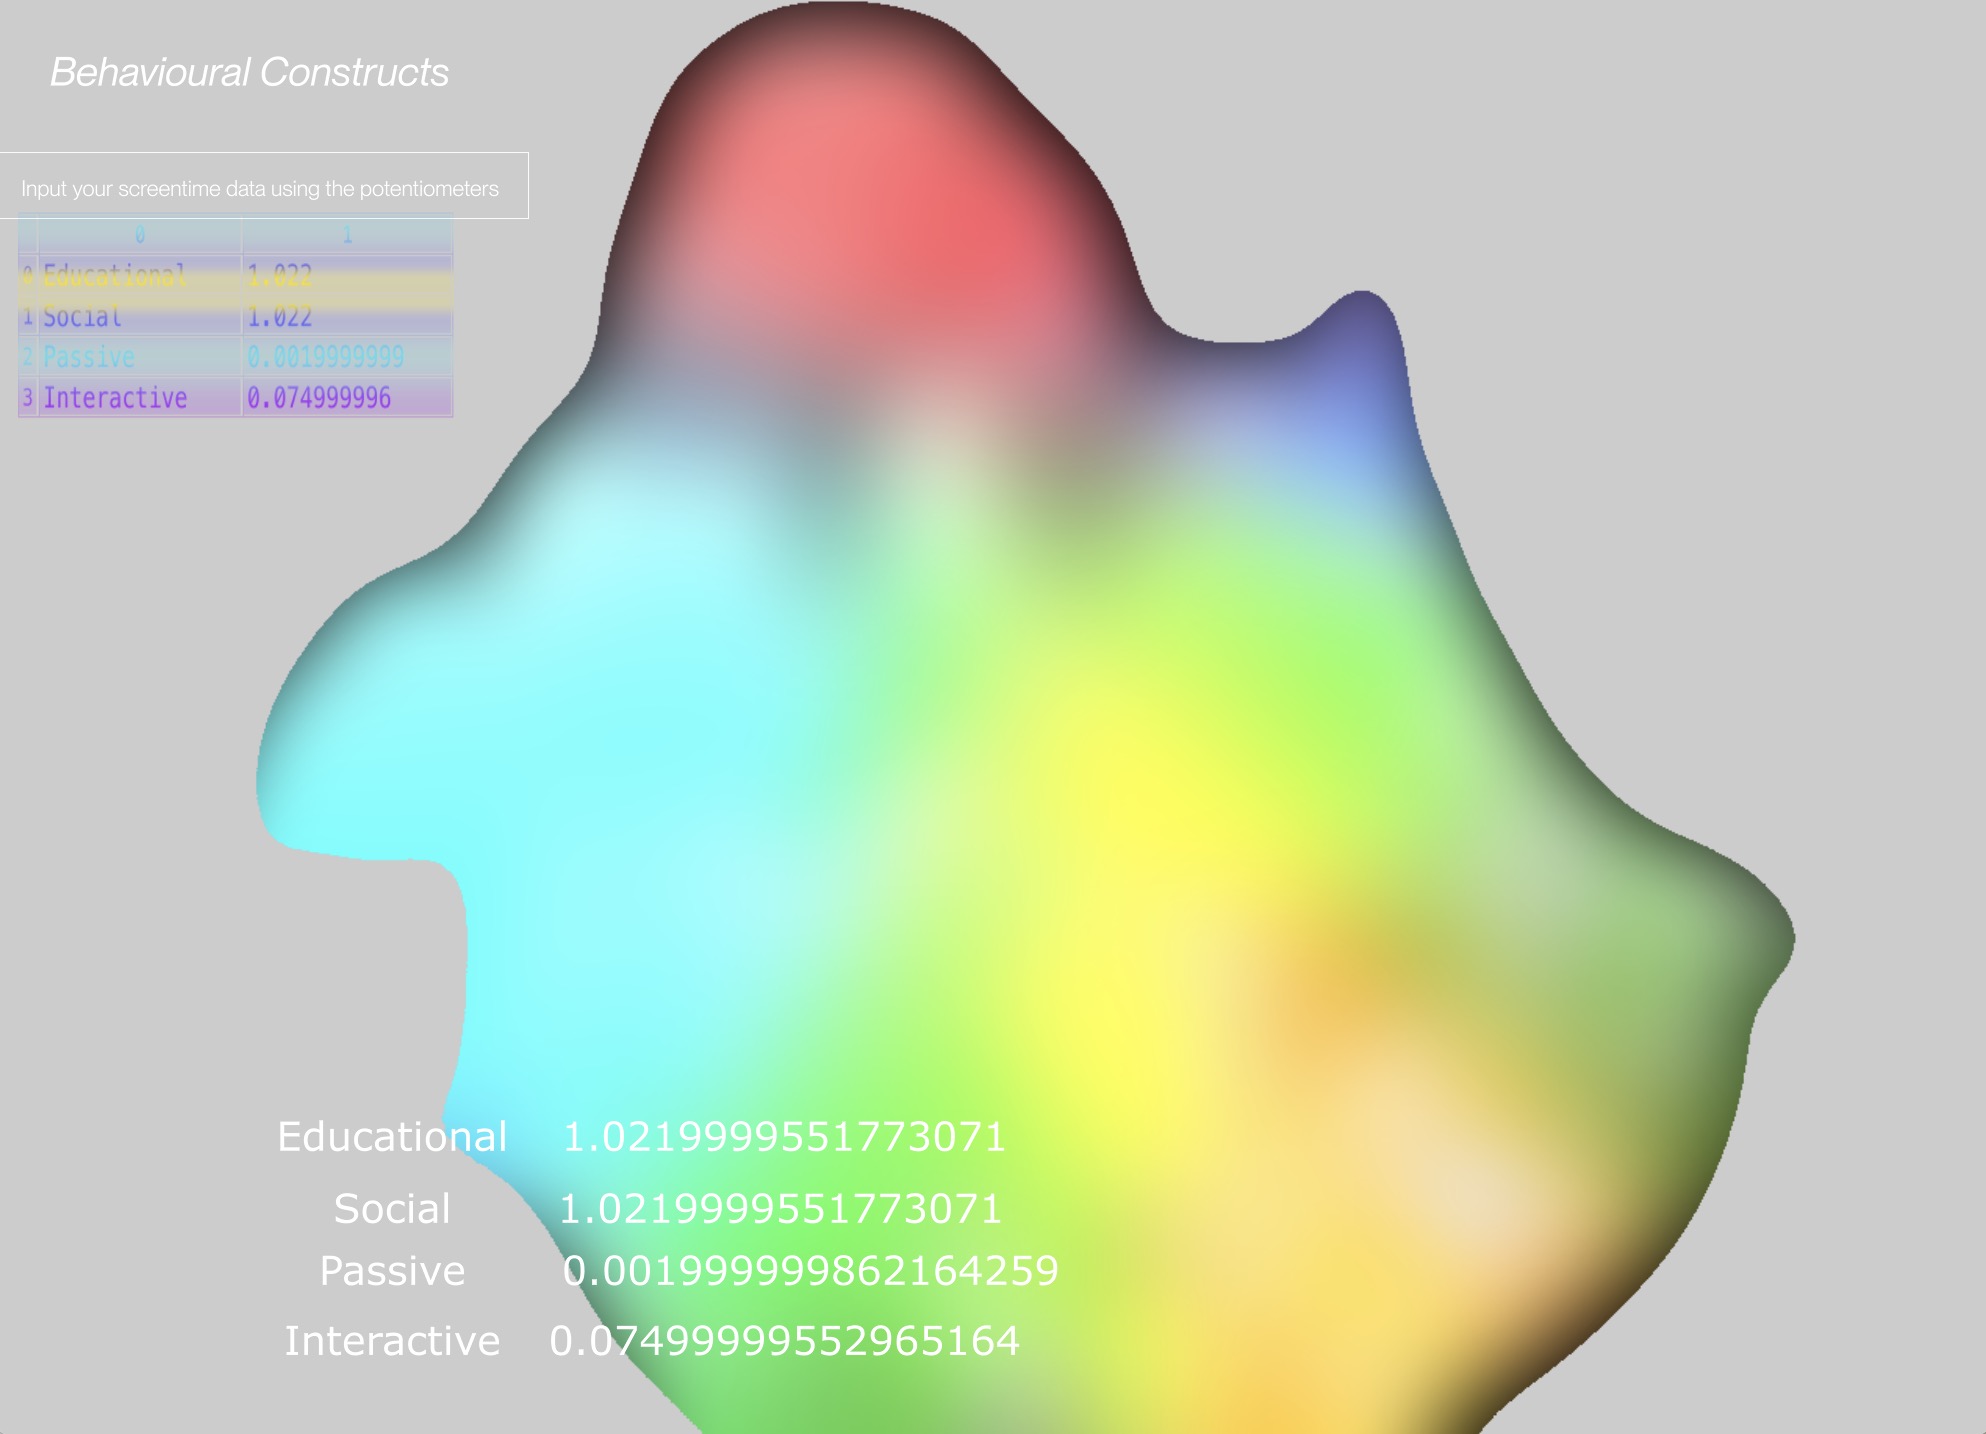
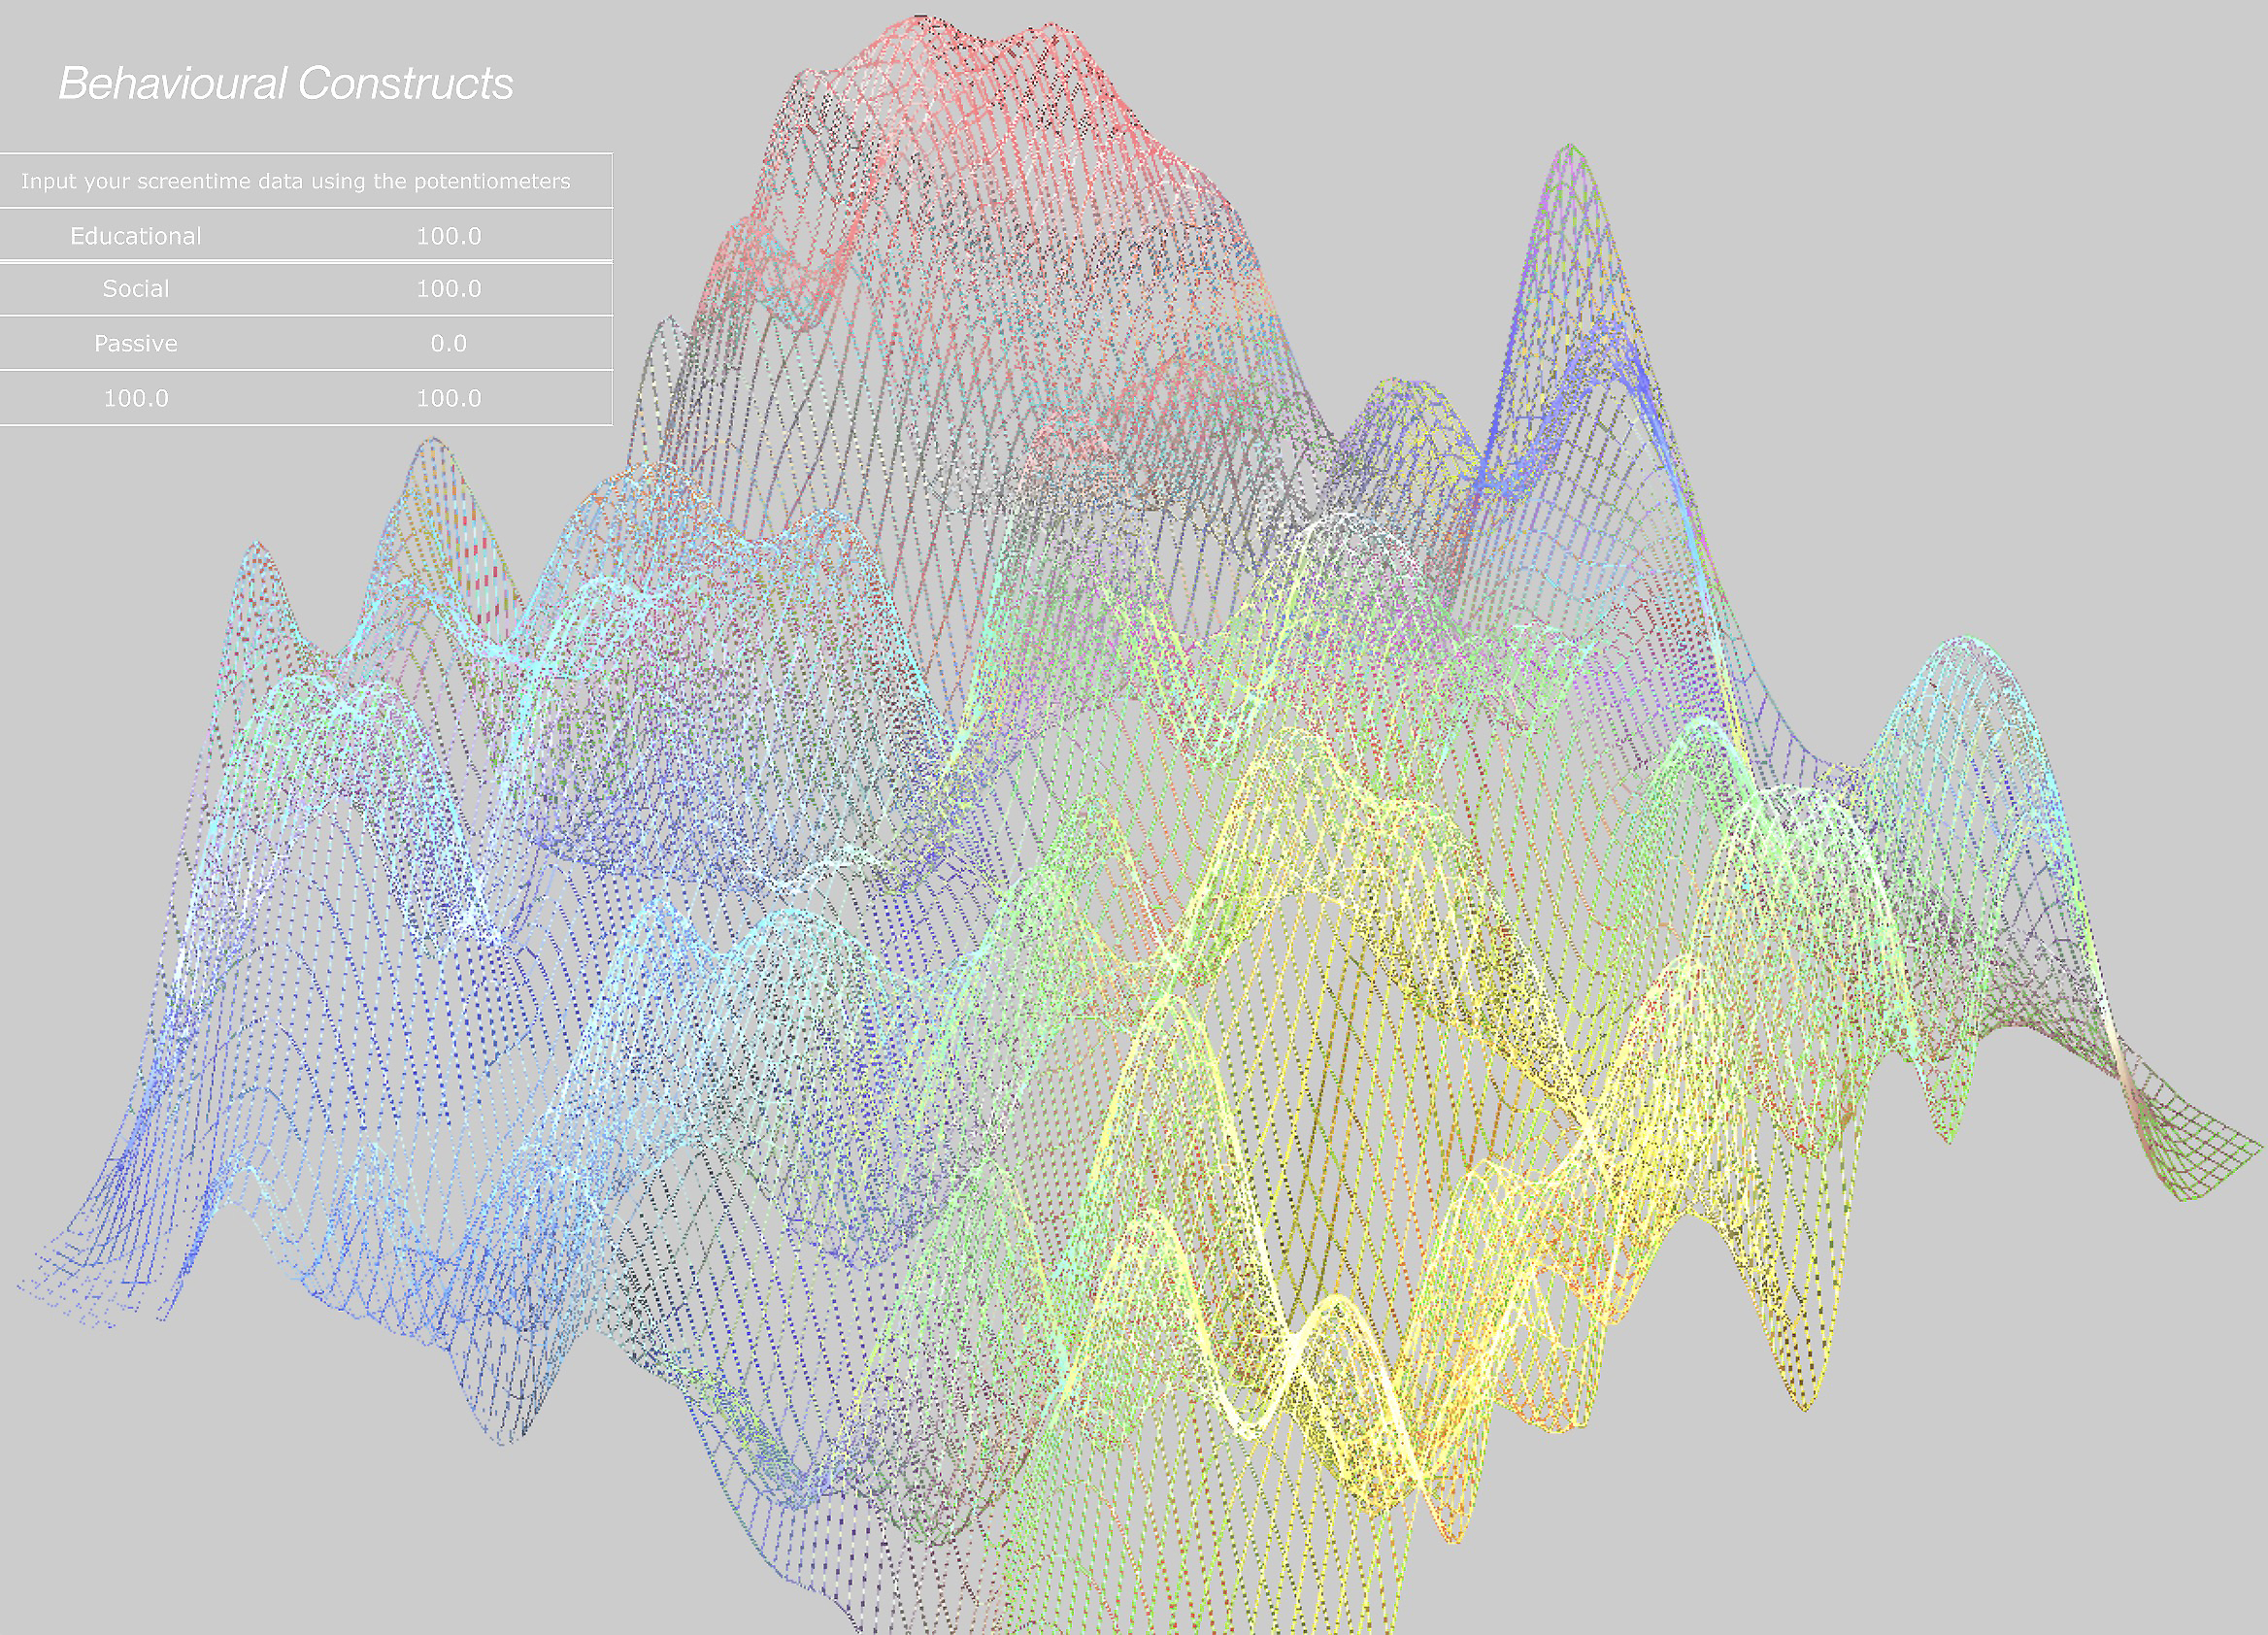
GRID SYSTEMS
Visual approaches include a combination of P5.JS & Touchdesigner explorations. First, the digital visualisations leveraged on computing power to generate the Behavioural Constructs. Coded experiments utilised P5.JS, a web editor, to generate the distortions onto a grid. This approach was efficient but also lacking in terms of the designer’s control of the scale, convexity and positioning of distortions. This application was mainly considered due to its ability to create interactive programs that can engage users in the creation of screentime visualisations. However, the design process of generative visuals come with limitations depending on the designer’s programming capabilities. After experimenting with several methods and techniques using code as a means to generate screentime data, visual explorations have taken a change towards Touchdesigner.

PARTICLE SYSTEMS
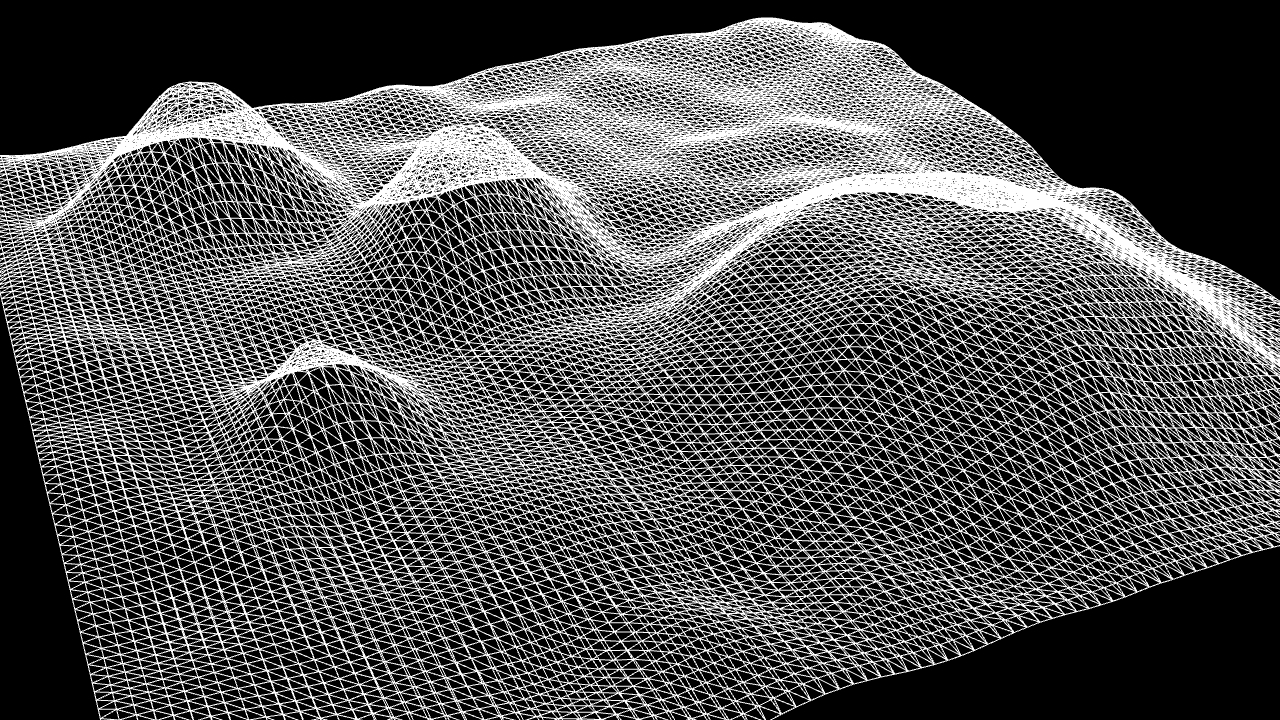
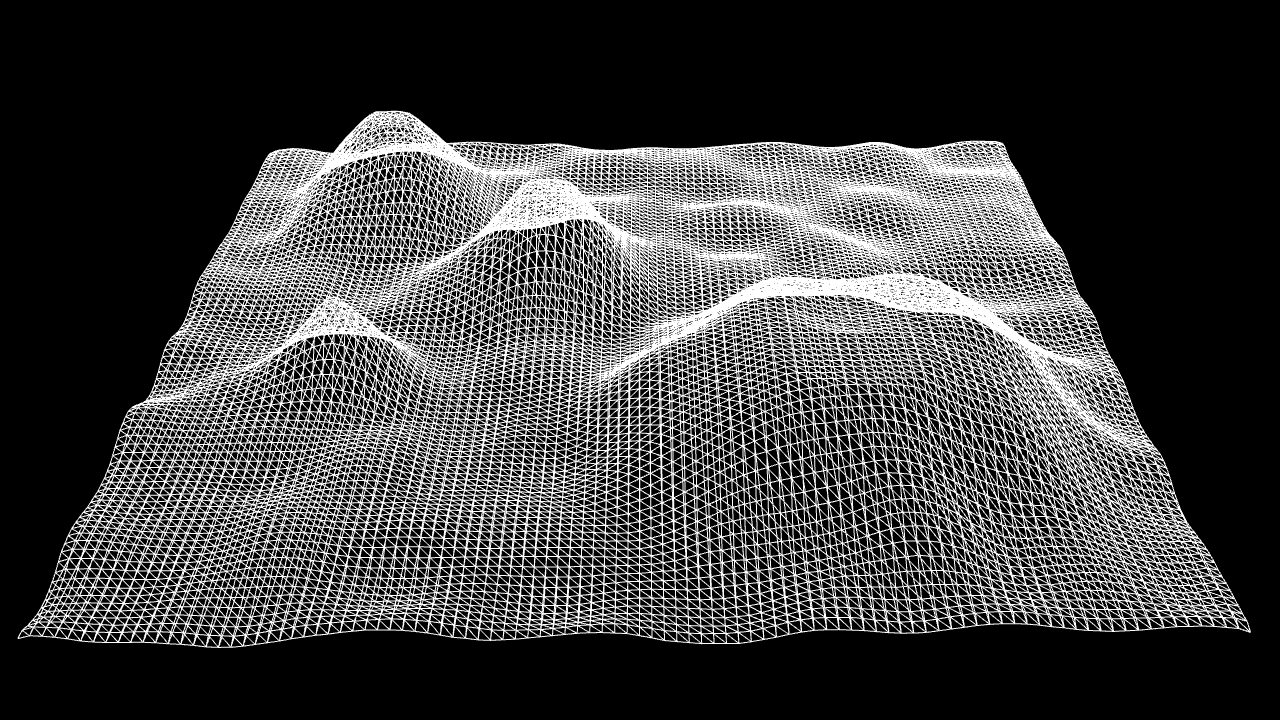
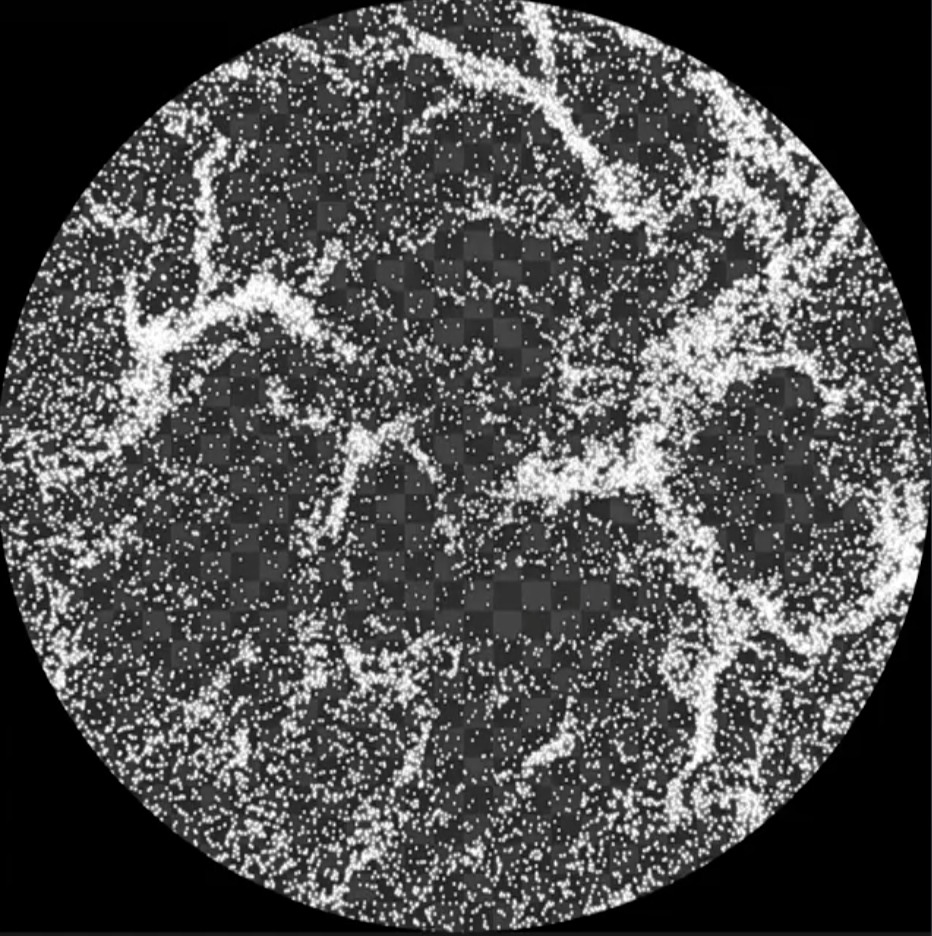
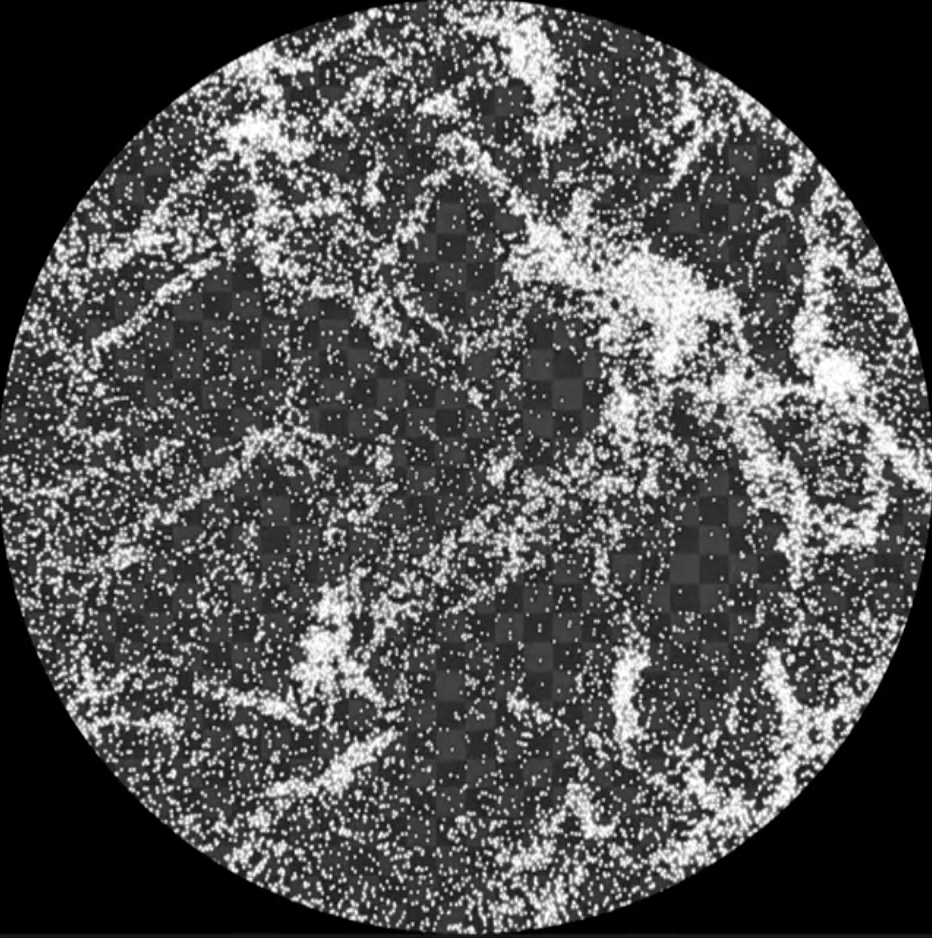
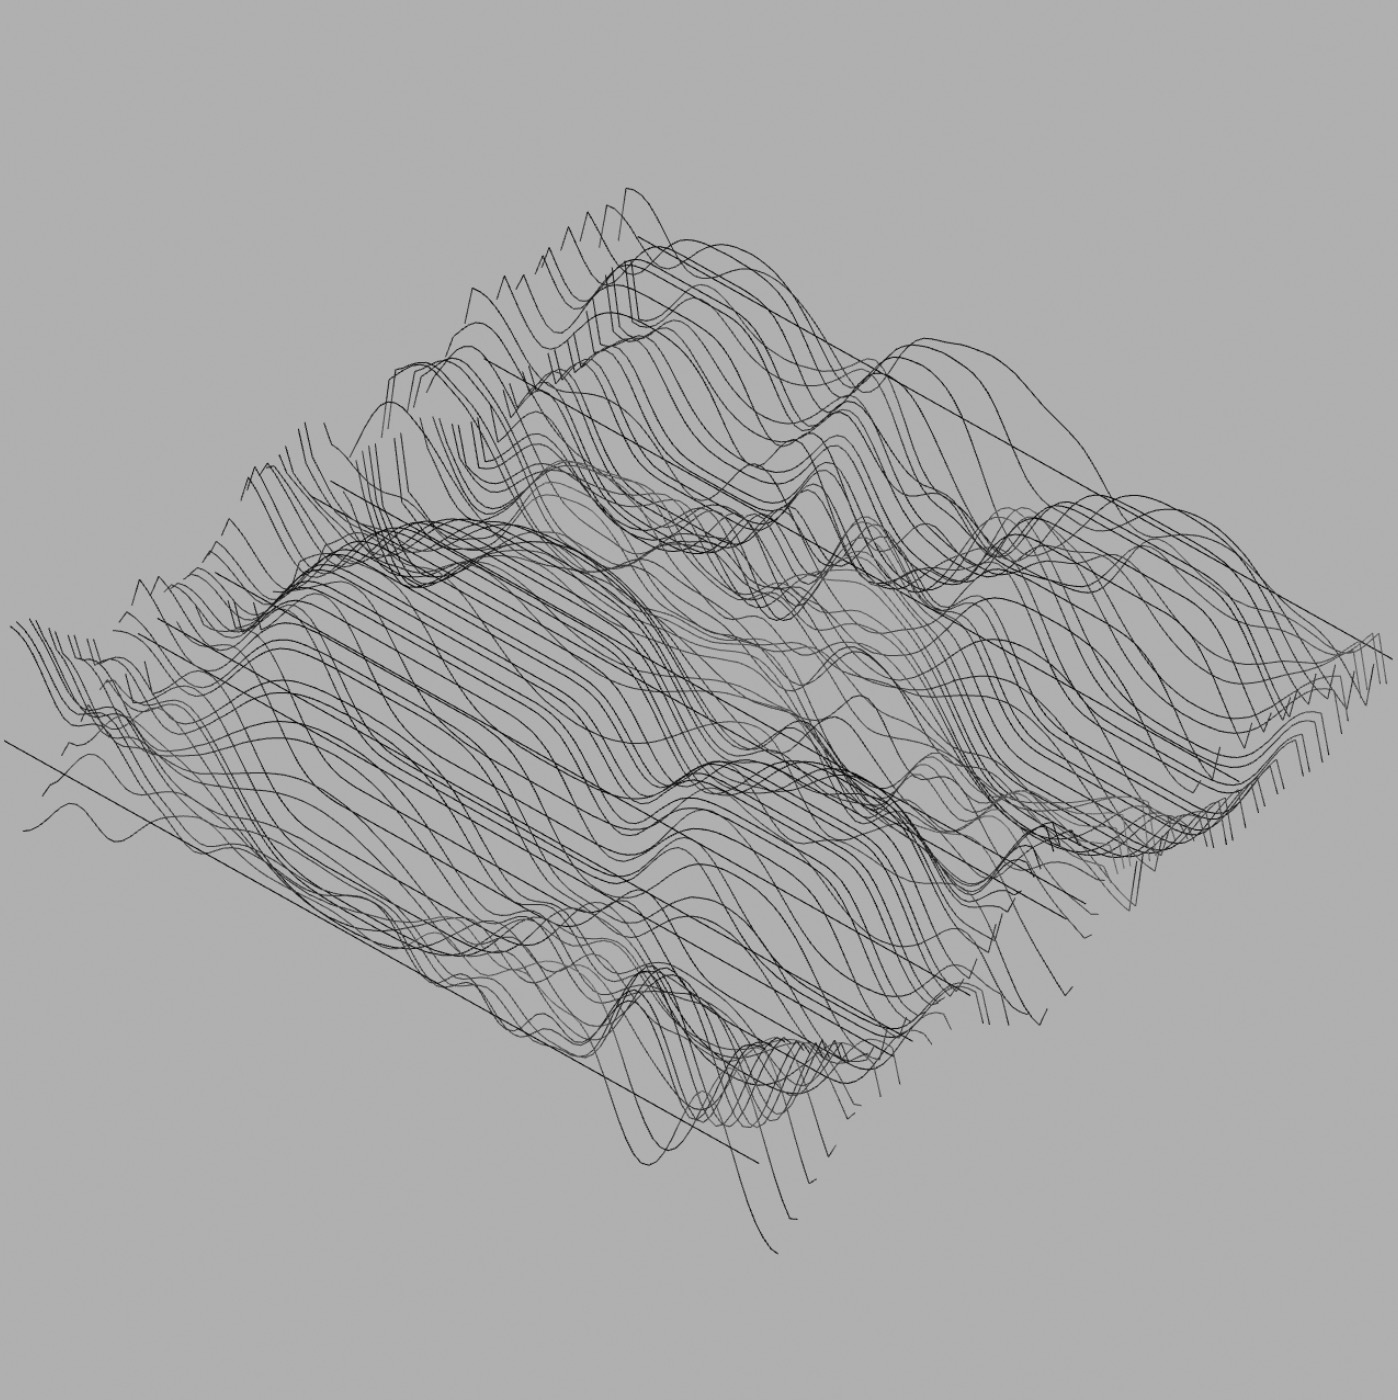
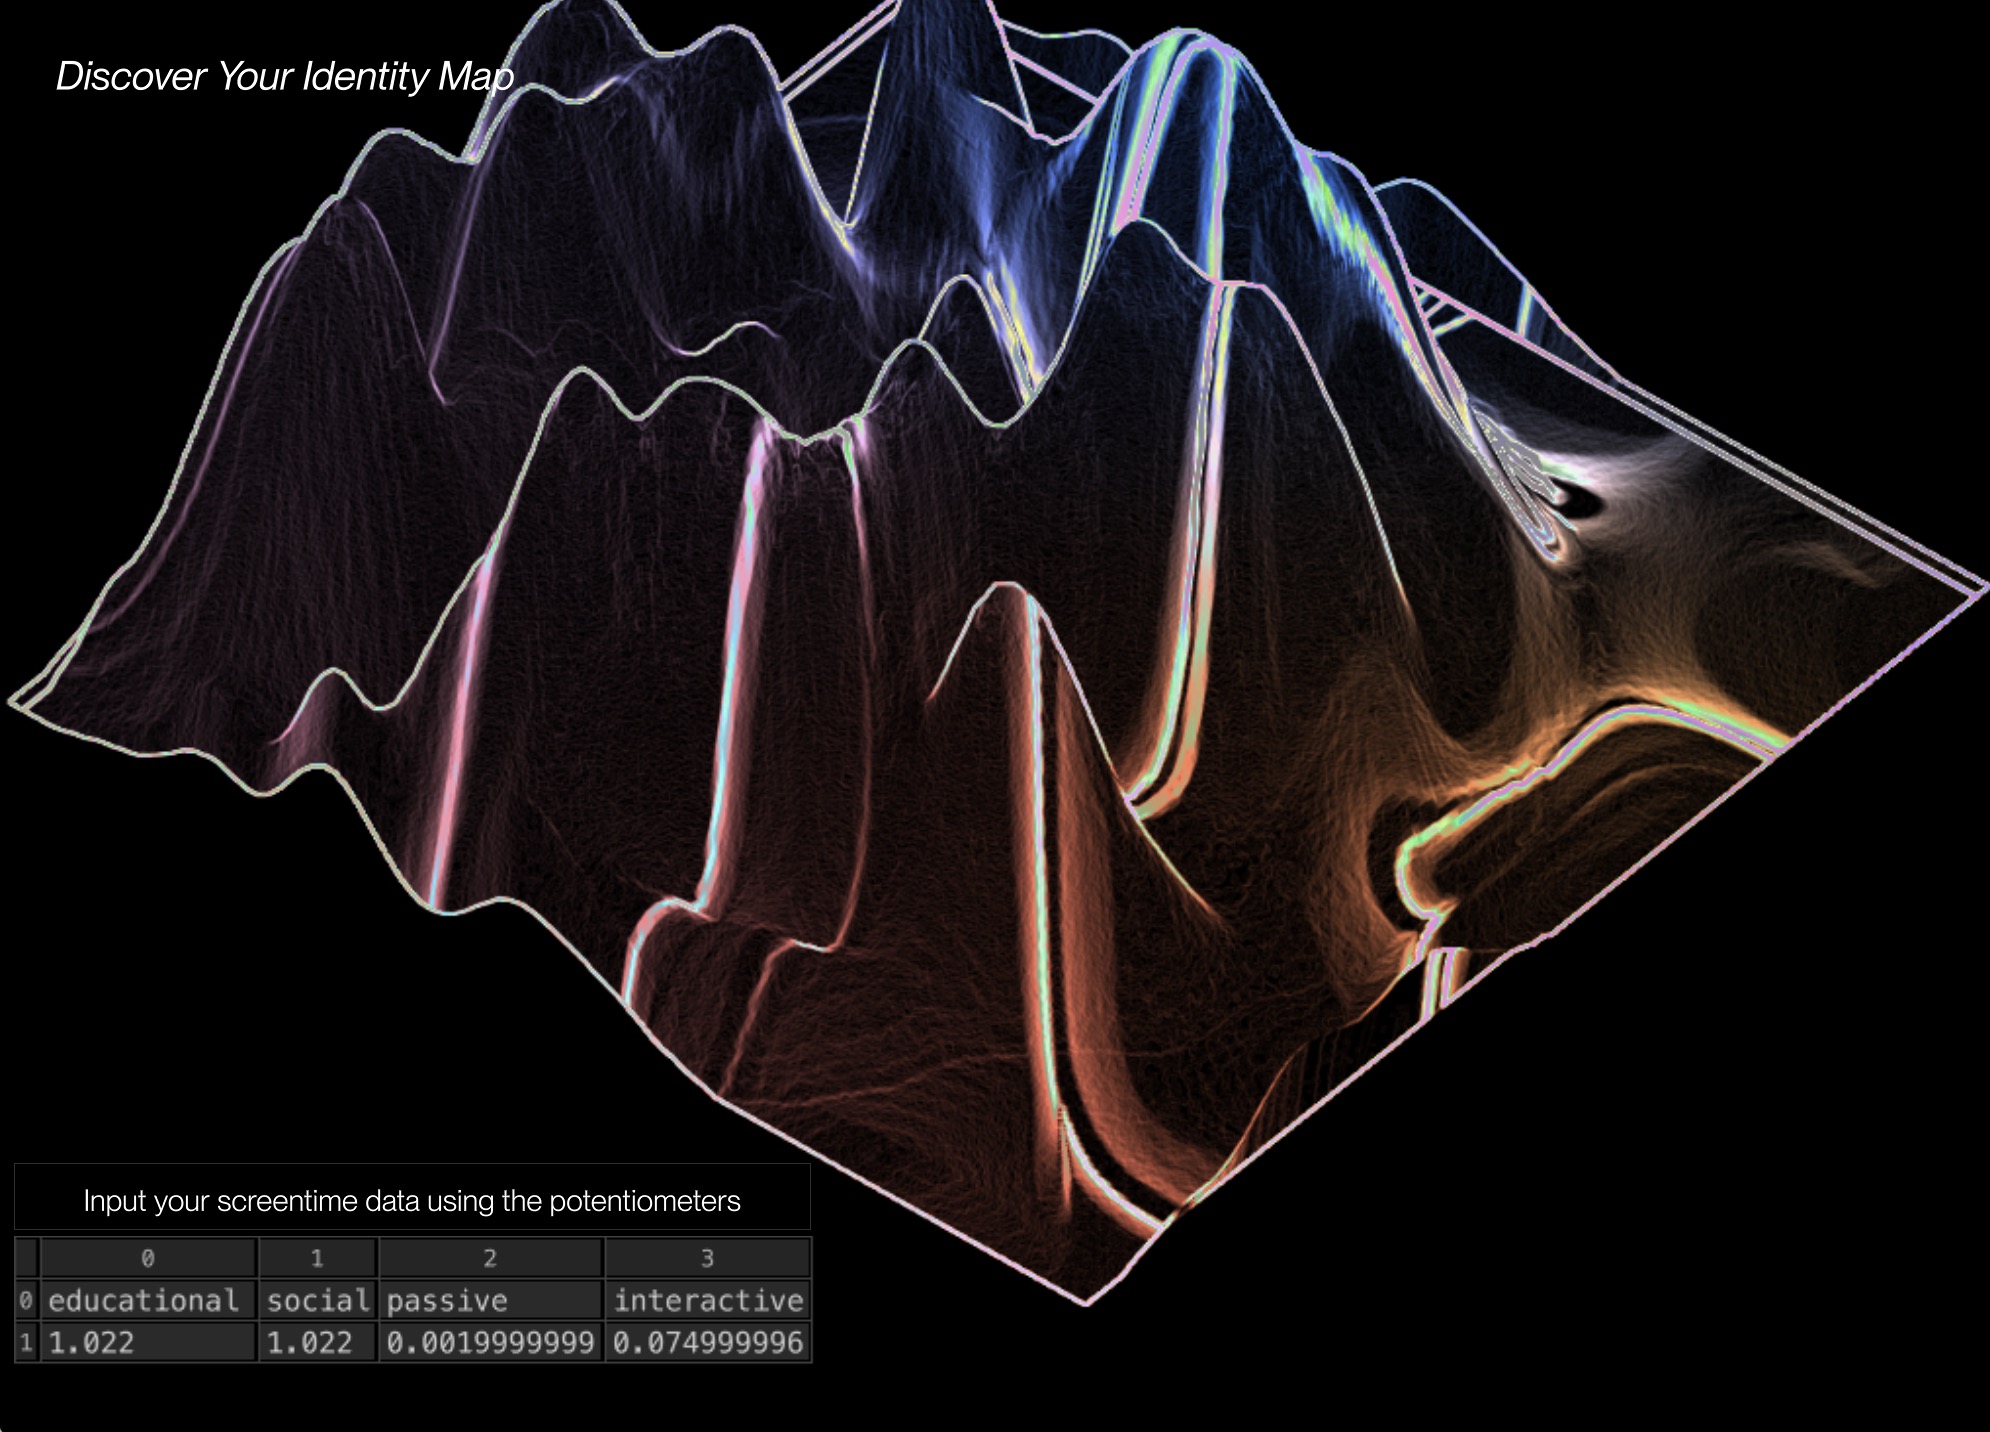
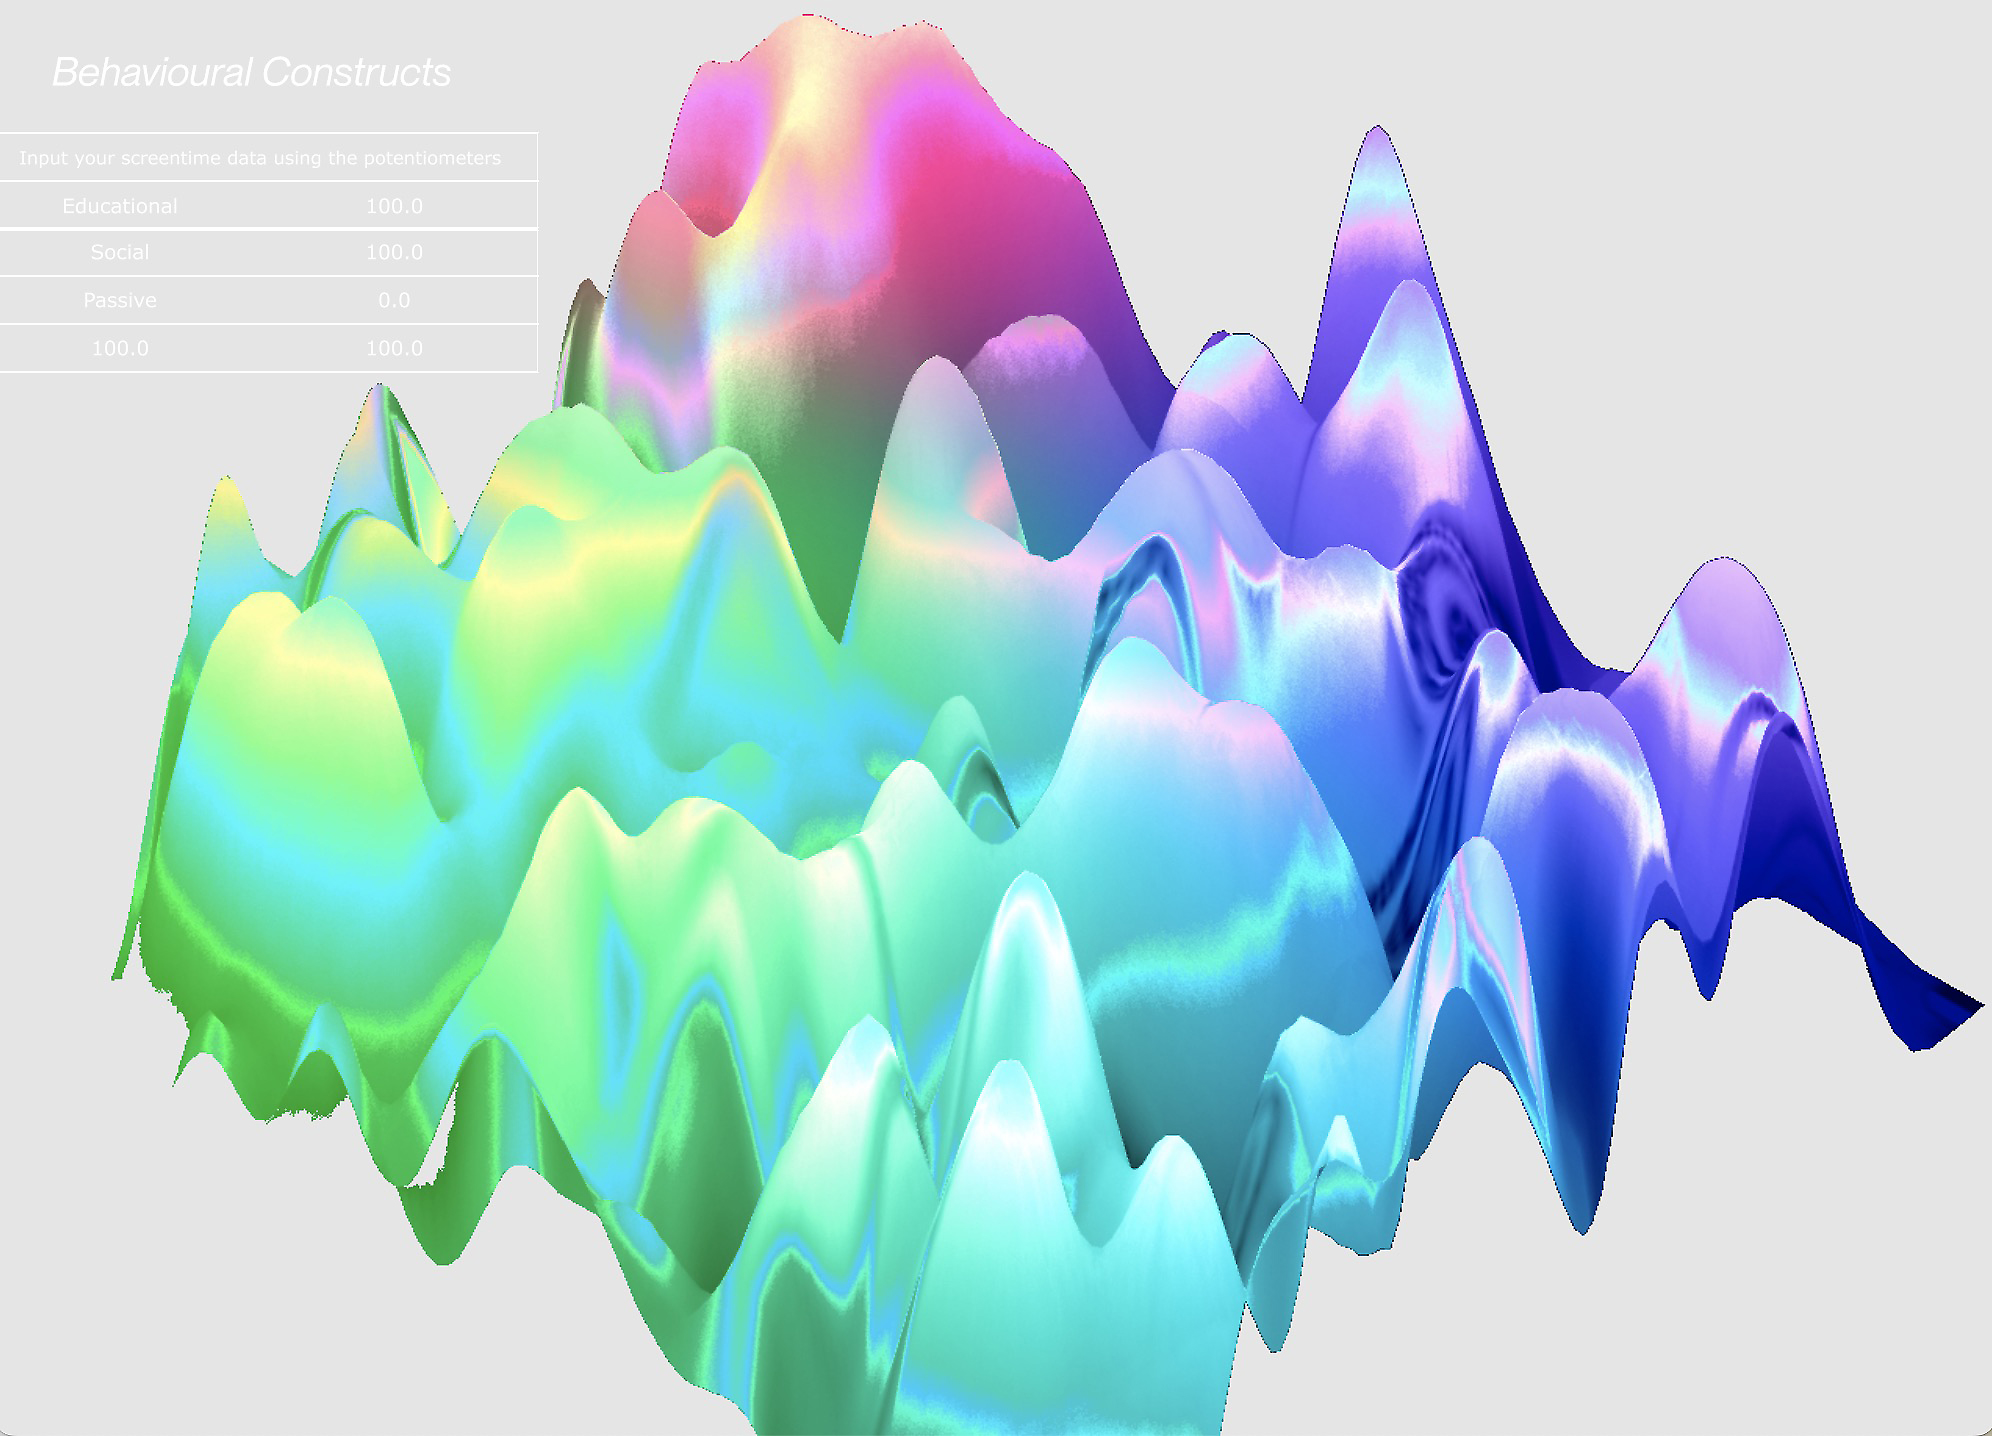
One of the Touchdesigner experiments also explores the use of particle systems as a means to create Behavioural Constructs.
Ridges formed from the overlapping of particles bring forth points for data interpretation. The patterns as seen in each particle system generated from different screentime data inputs create a consistent and systematic way of data visualisation.
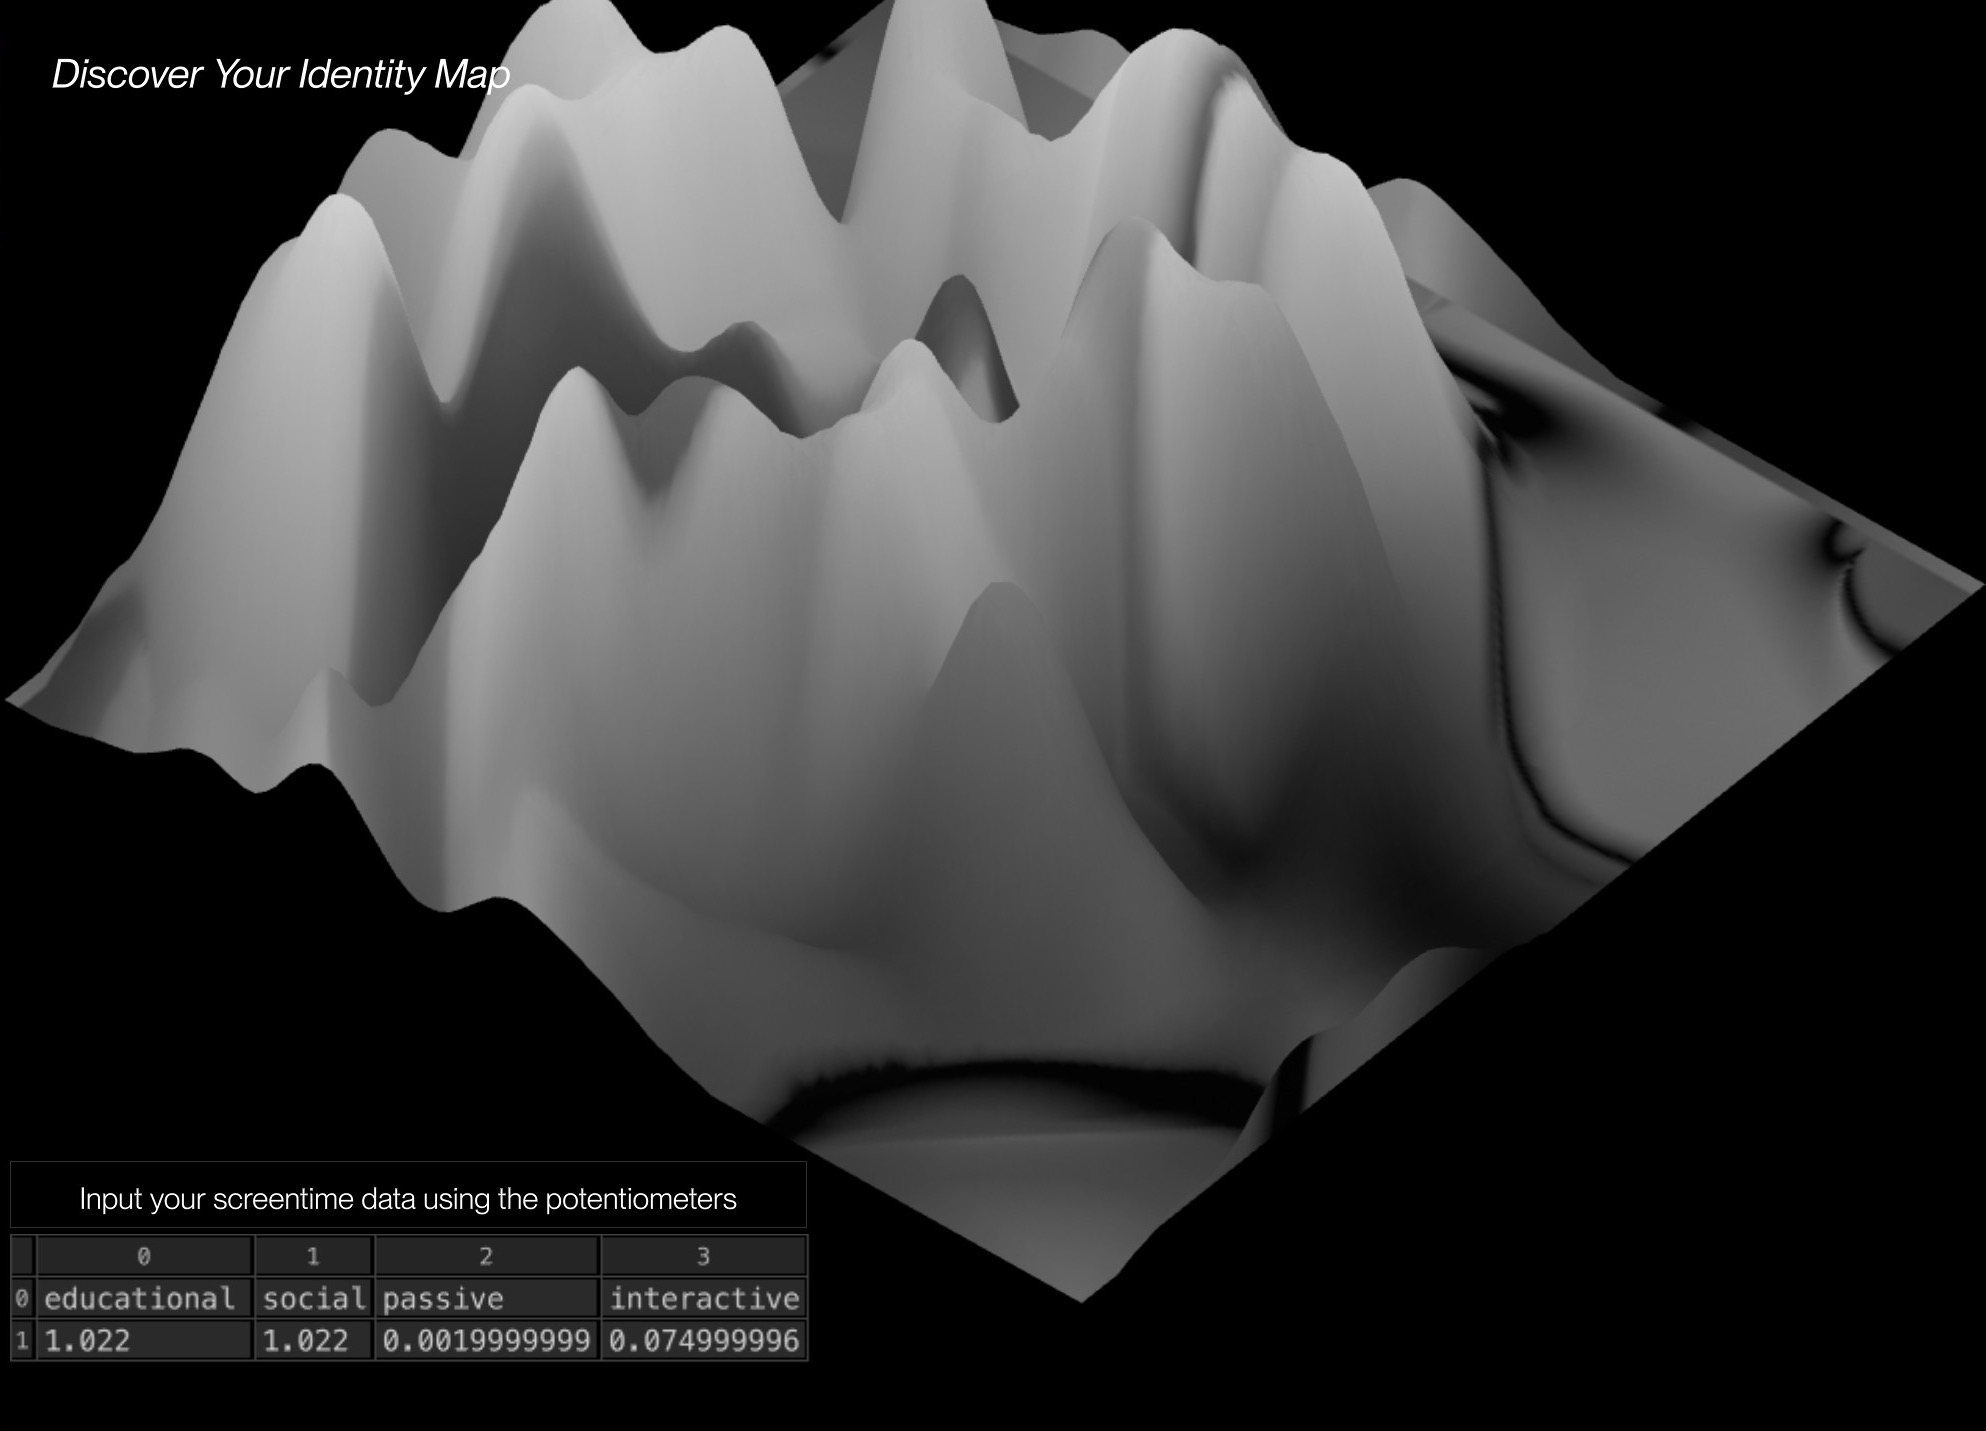
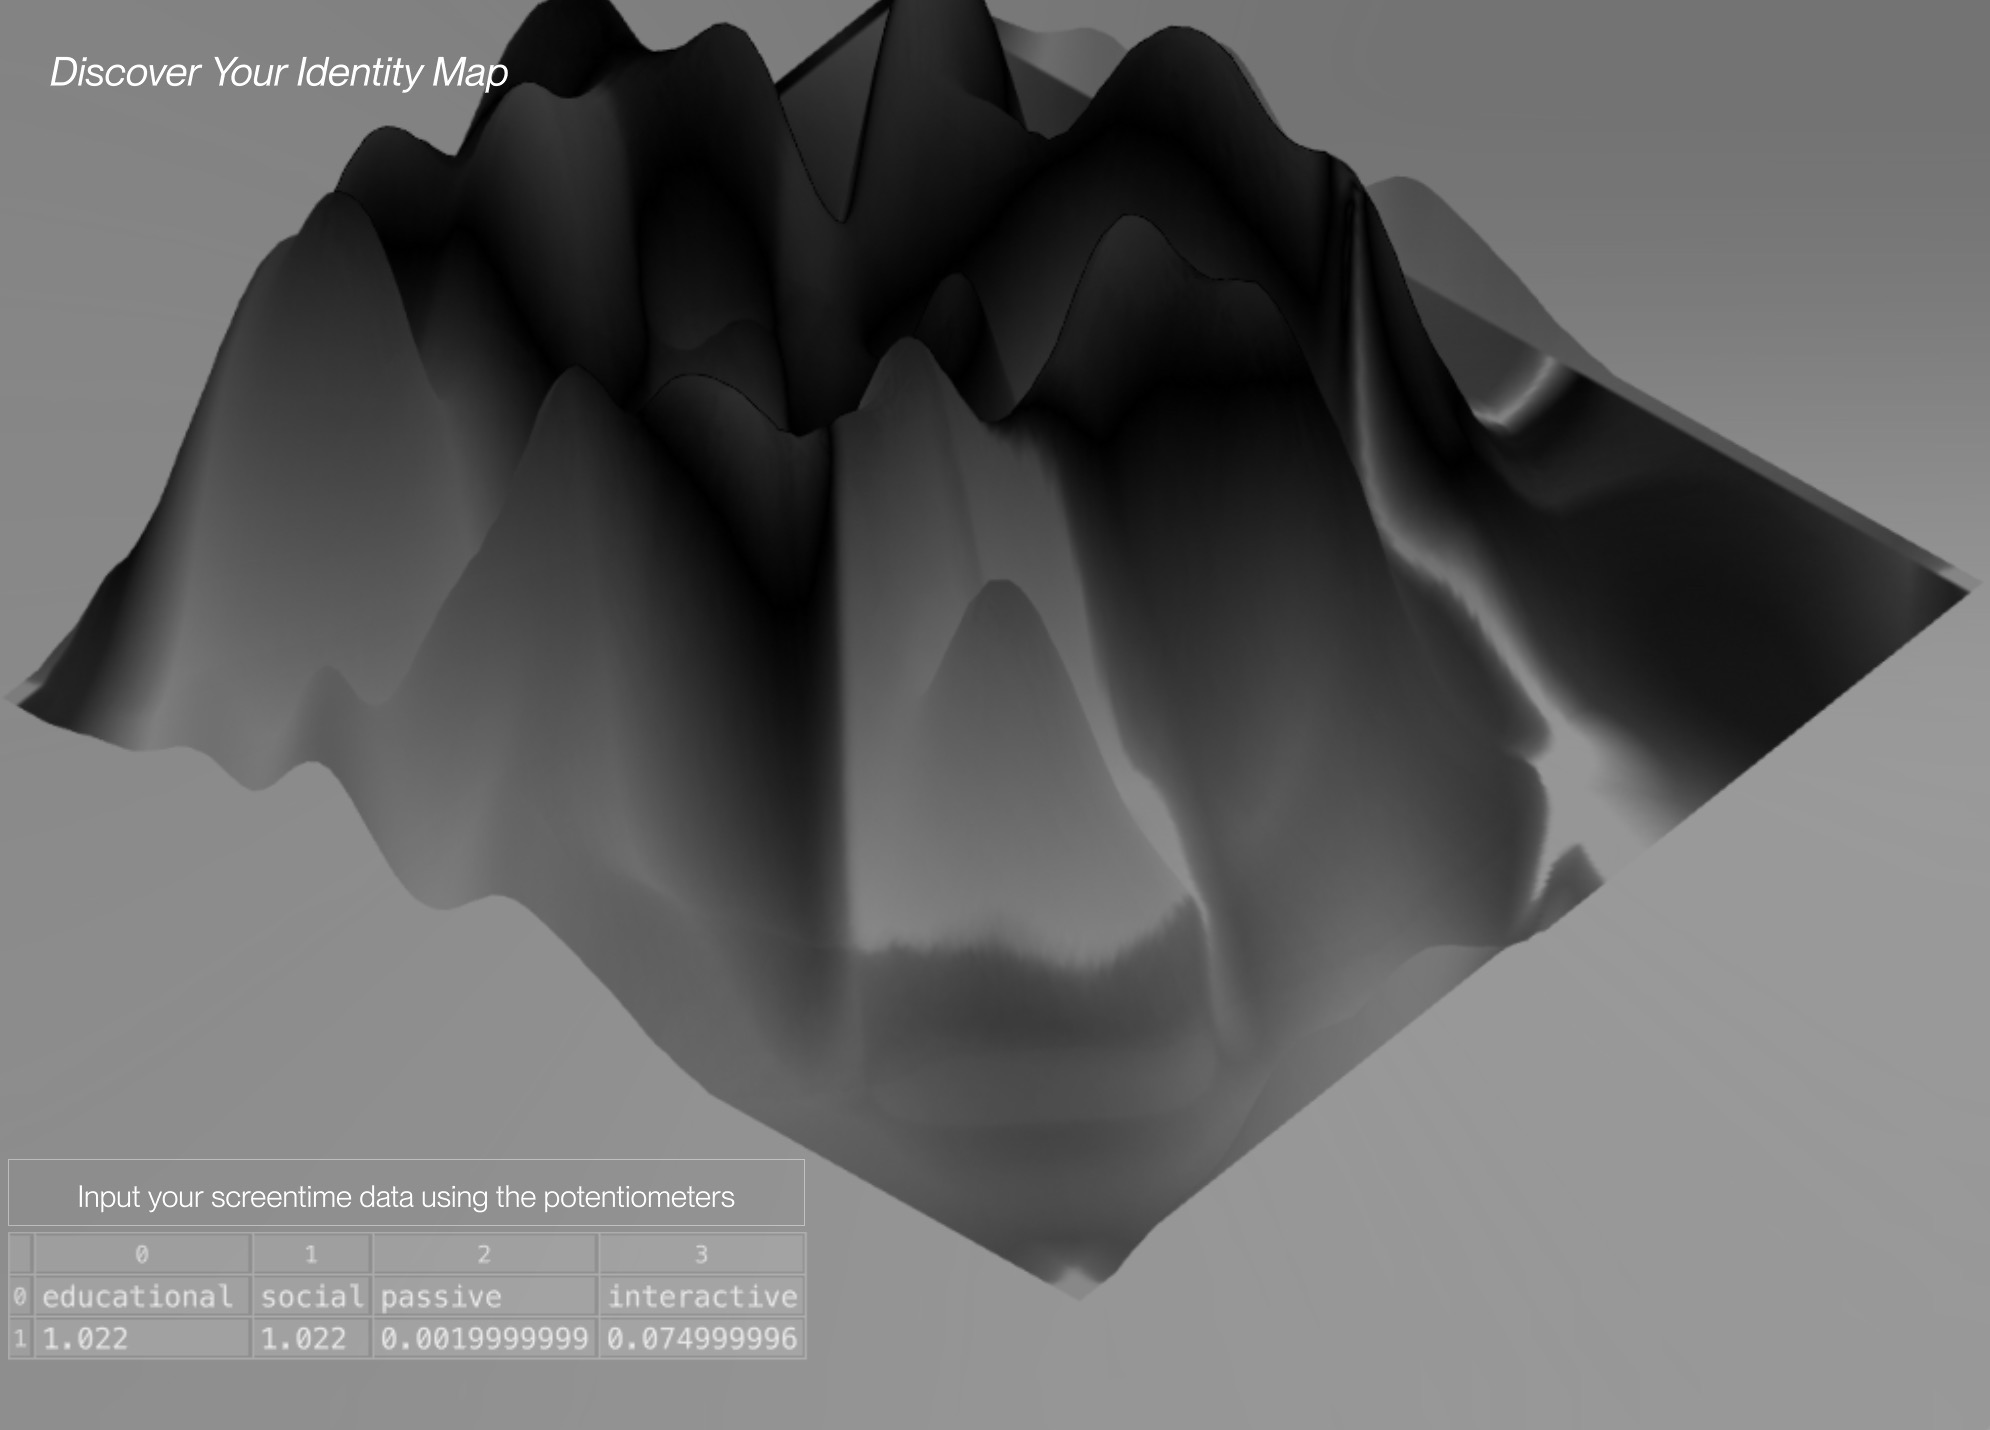
Explorations revert back to the idea of identity maps as the concept of digital footprint being visualised as a landscape that enables users to embark on journeys of discovery into their screentime activities correlates more effectively when directly portrayed through a naturesque visual

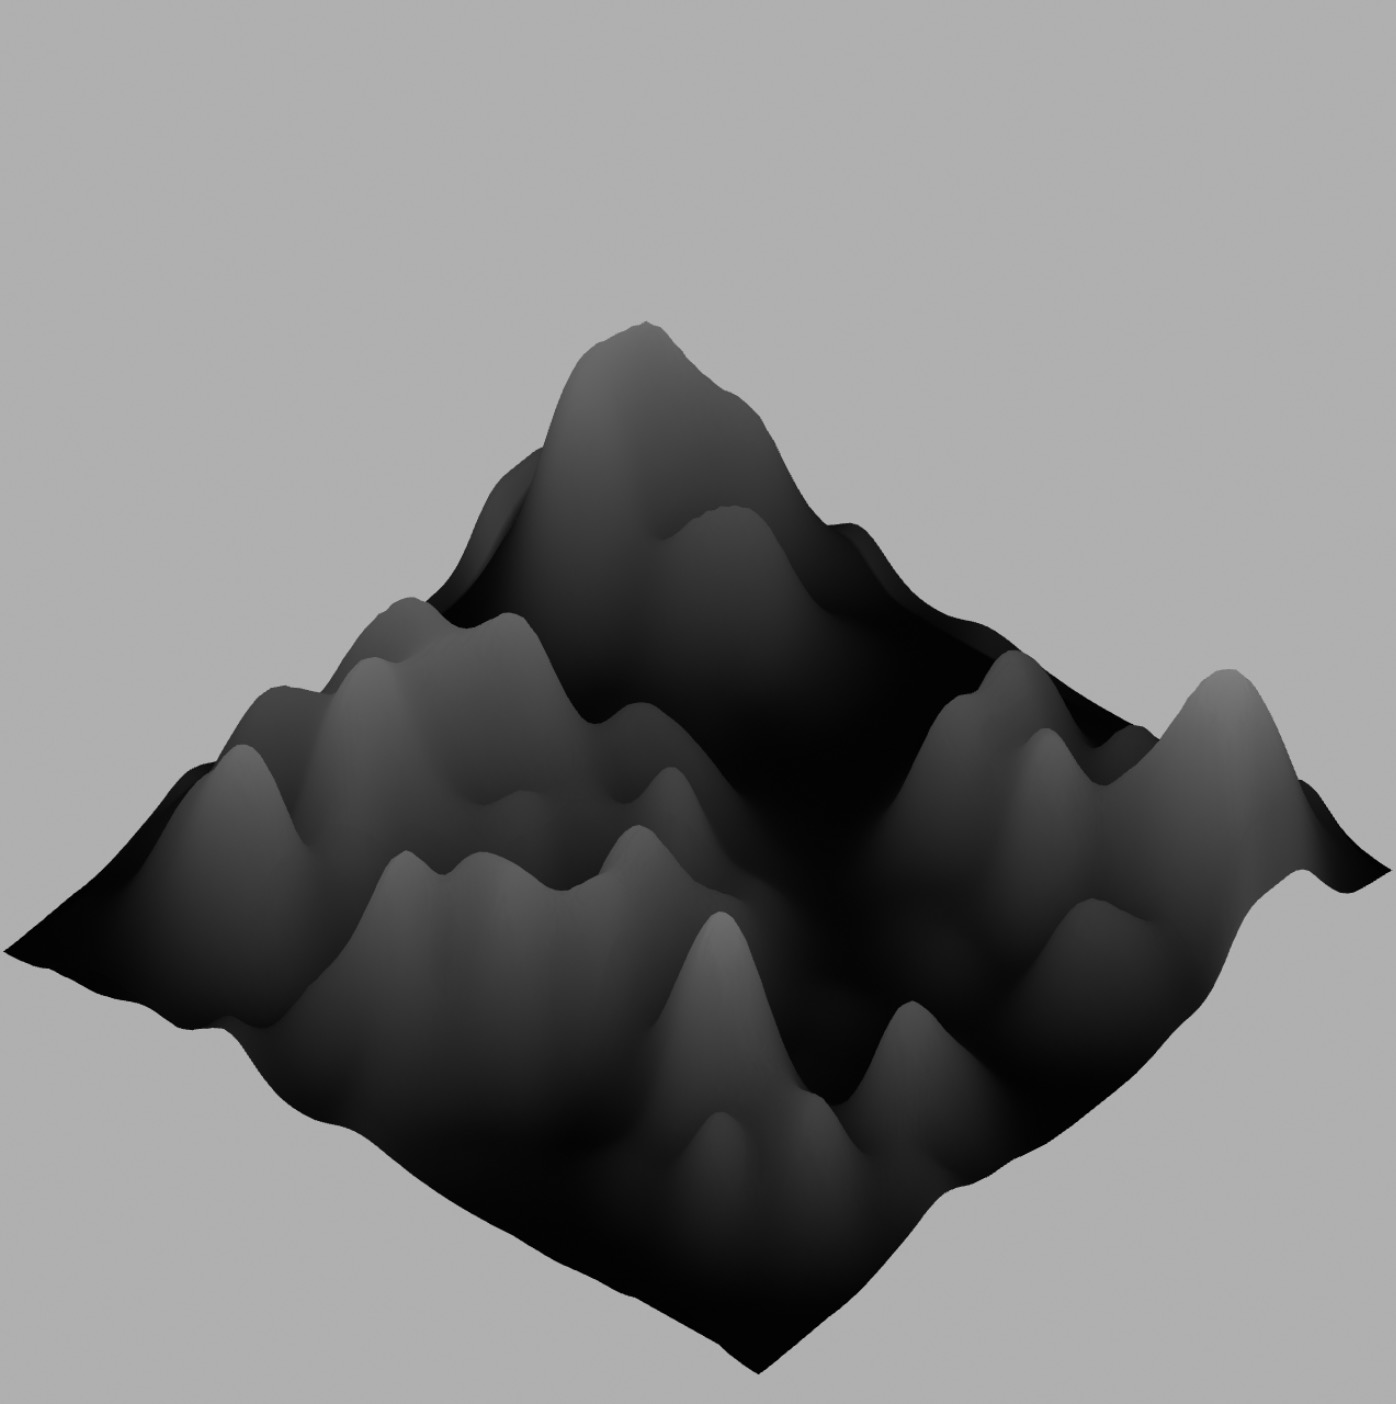
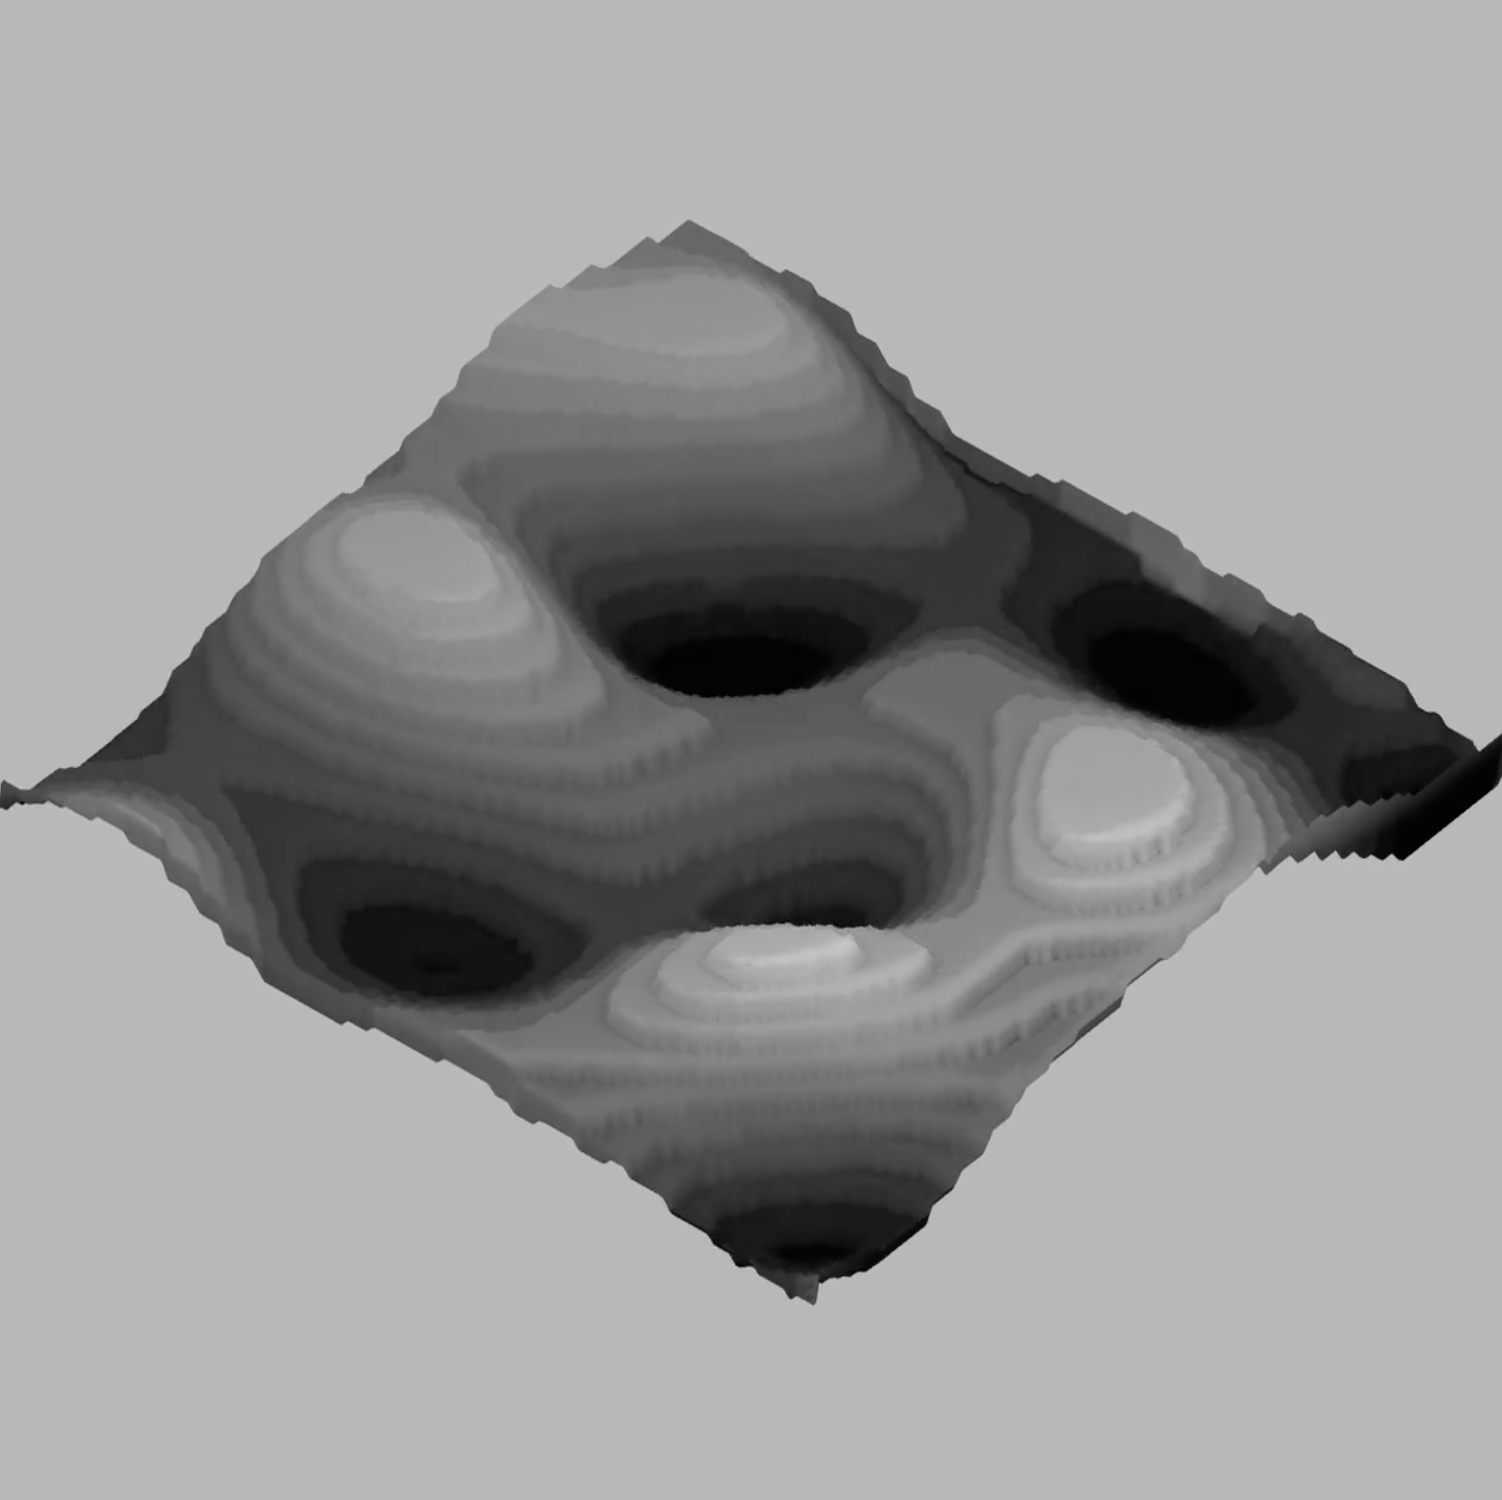


The generated visual encompasses the concepts of digital footprint and behavioural identity, Visual explorations are focused on the communication of screentime data activity and trends. The generated outcome is approached through various visual applications and cues to portray the different screentime categories. By experimenting with textures, colours and patterns, the types of screentime activity representation are compared and evaluated to determine the best visual portrayal. Several measures are taken into consideration when building an appropriate visual implementation, these include–the readability of the data, the efficacy of data interpretation and the ability to maintain a visual balance between data visualisation and abstract representations.


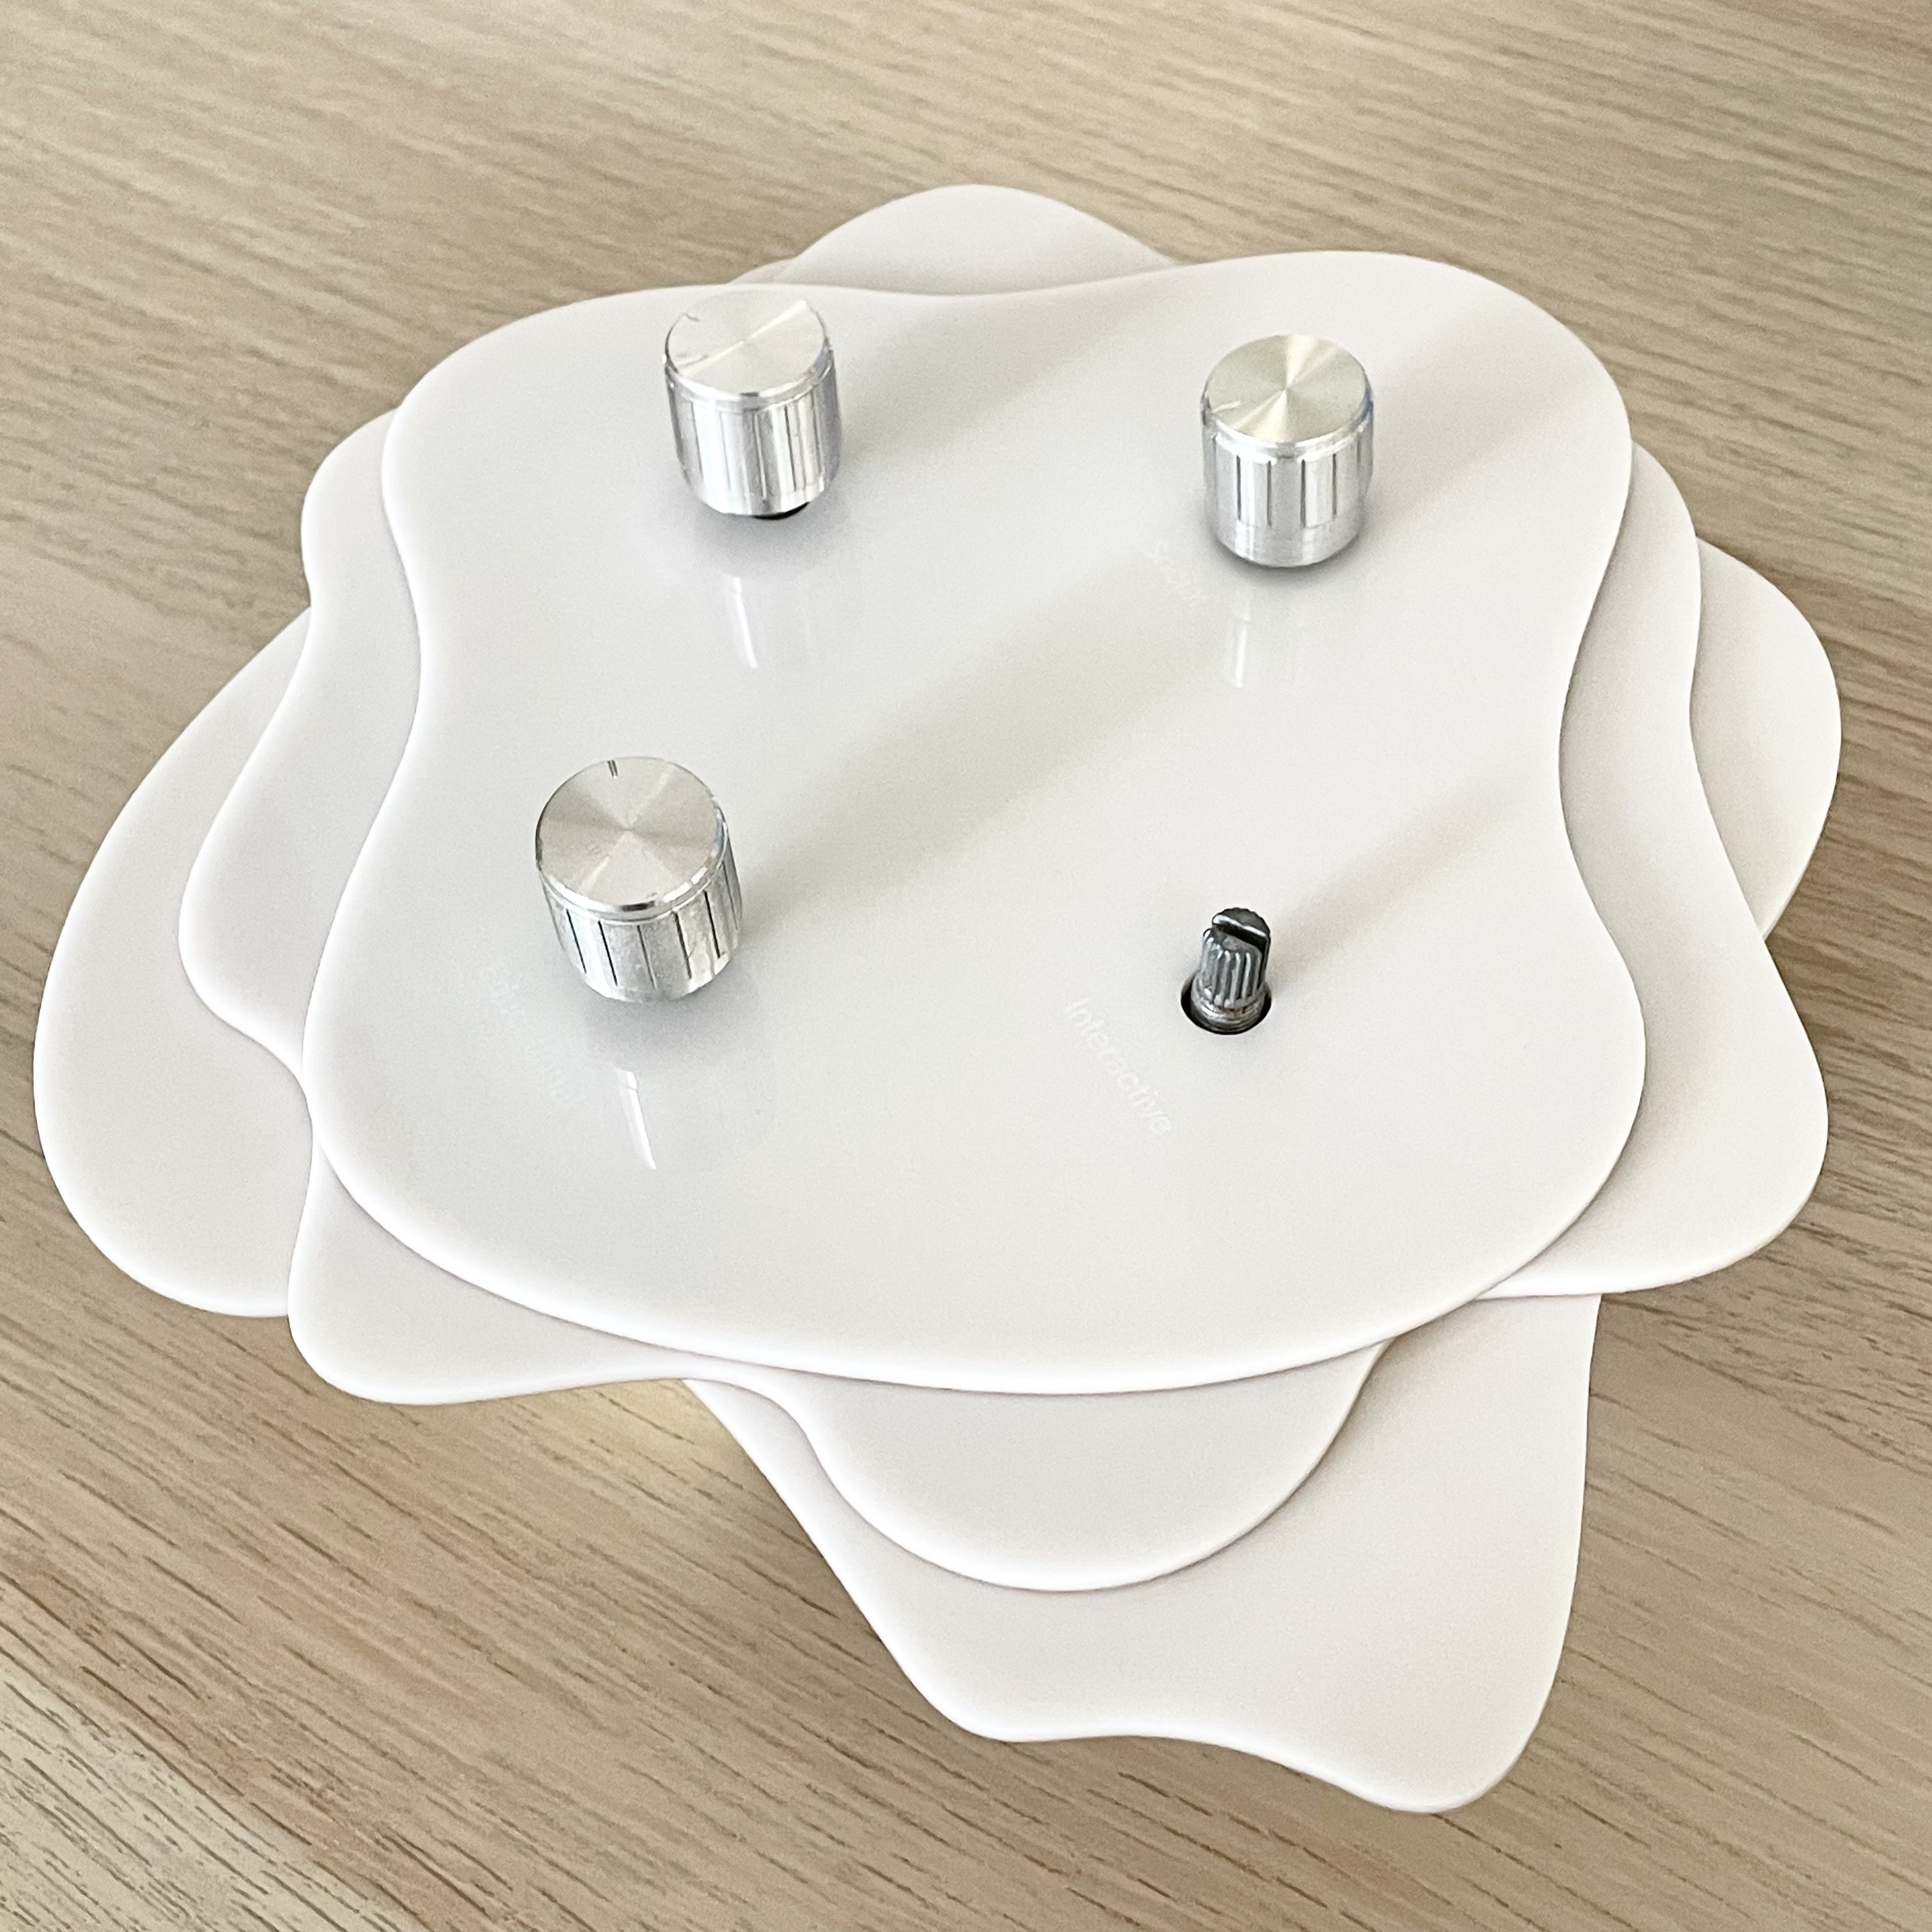
Further refinements to the construction of the prototype were done to package the extensive set-up and act as a visual declutter to conceal the wiring of potentiometers.
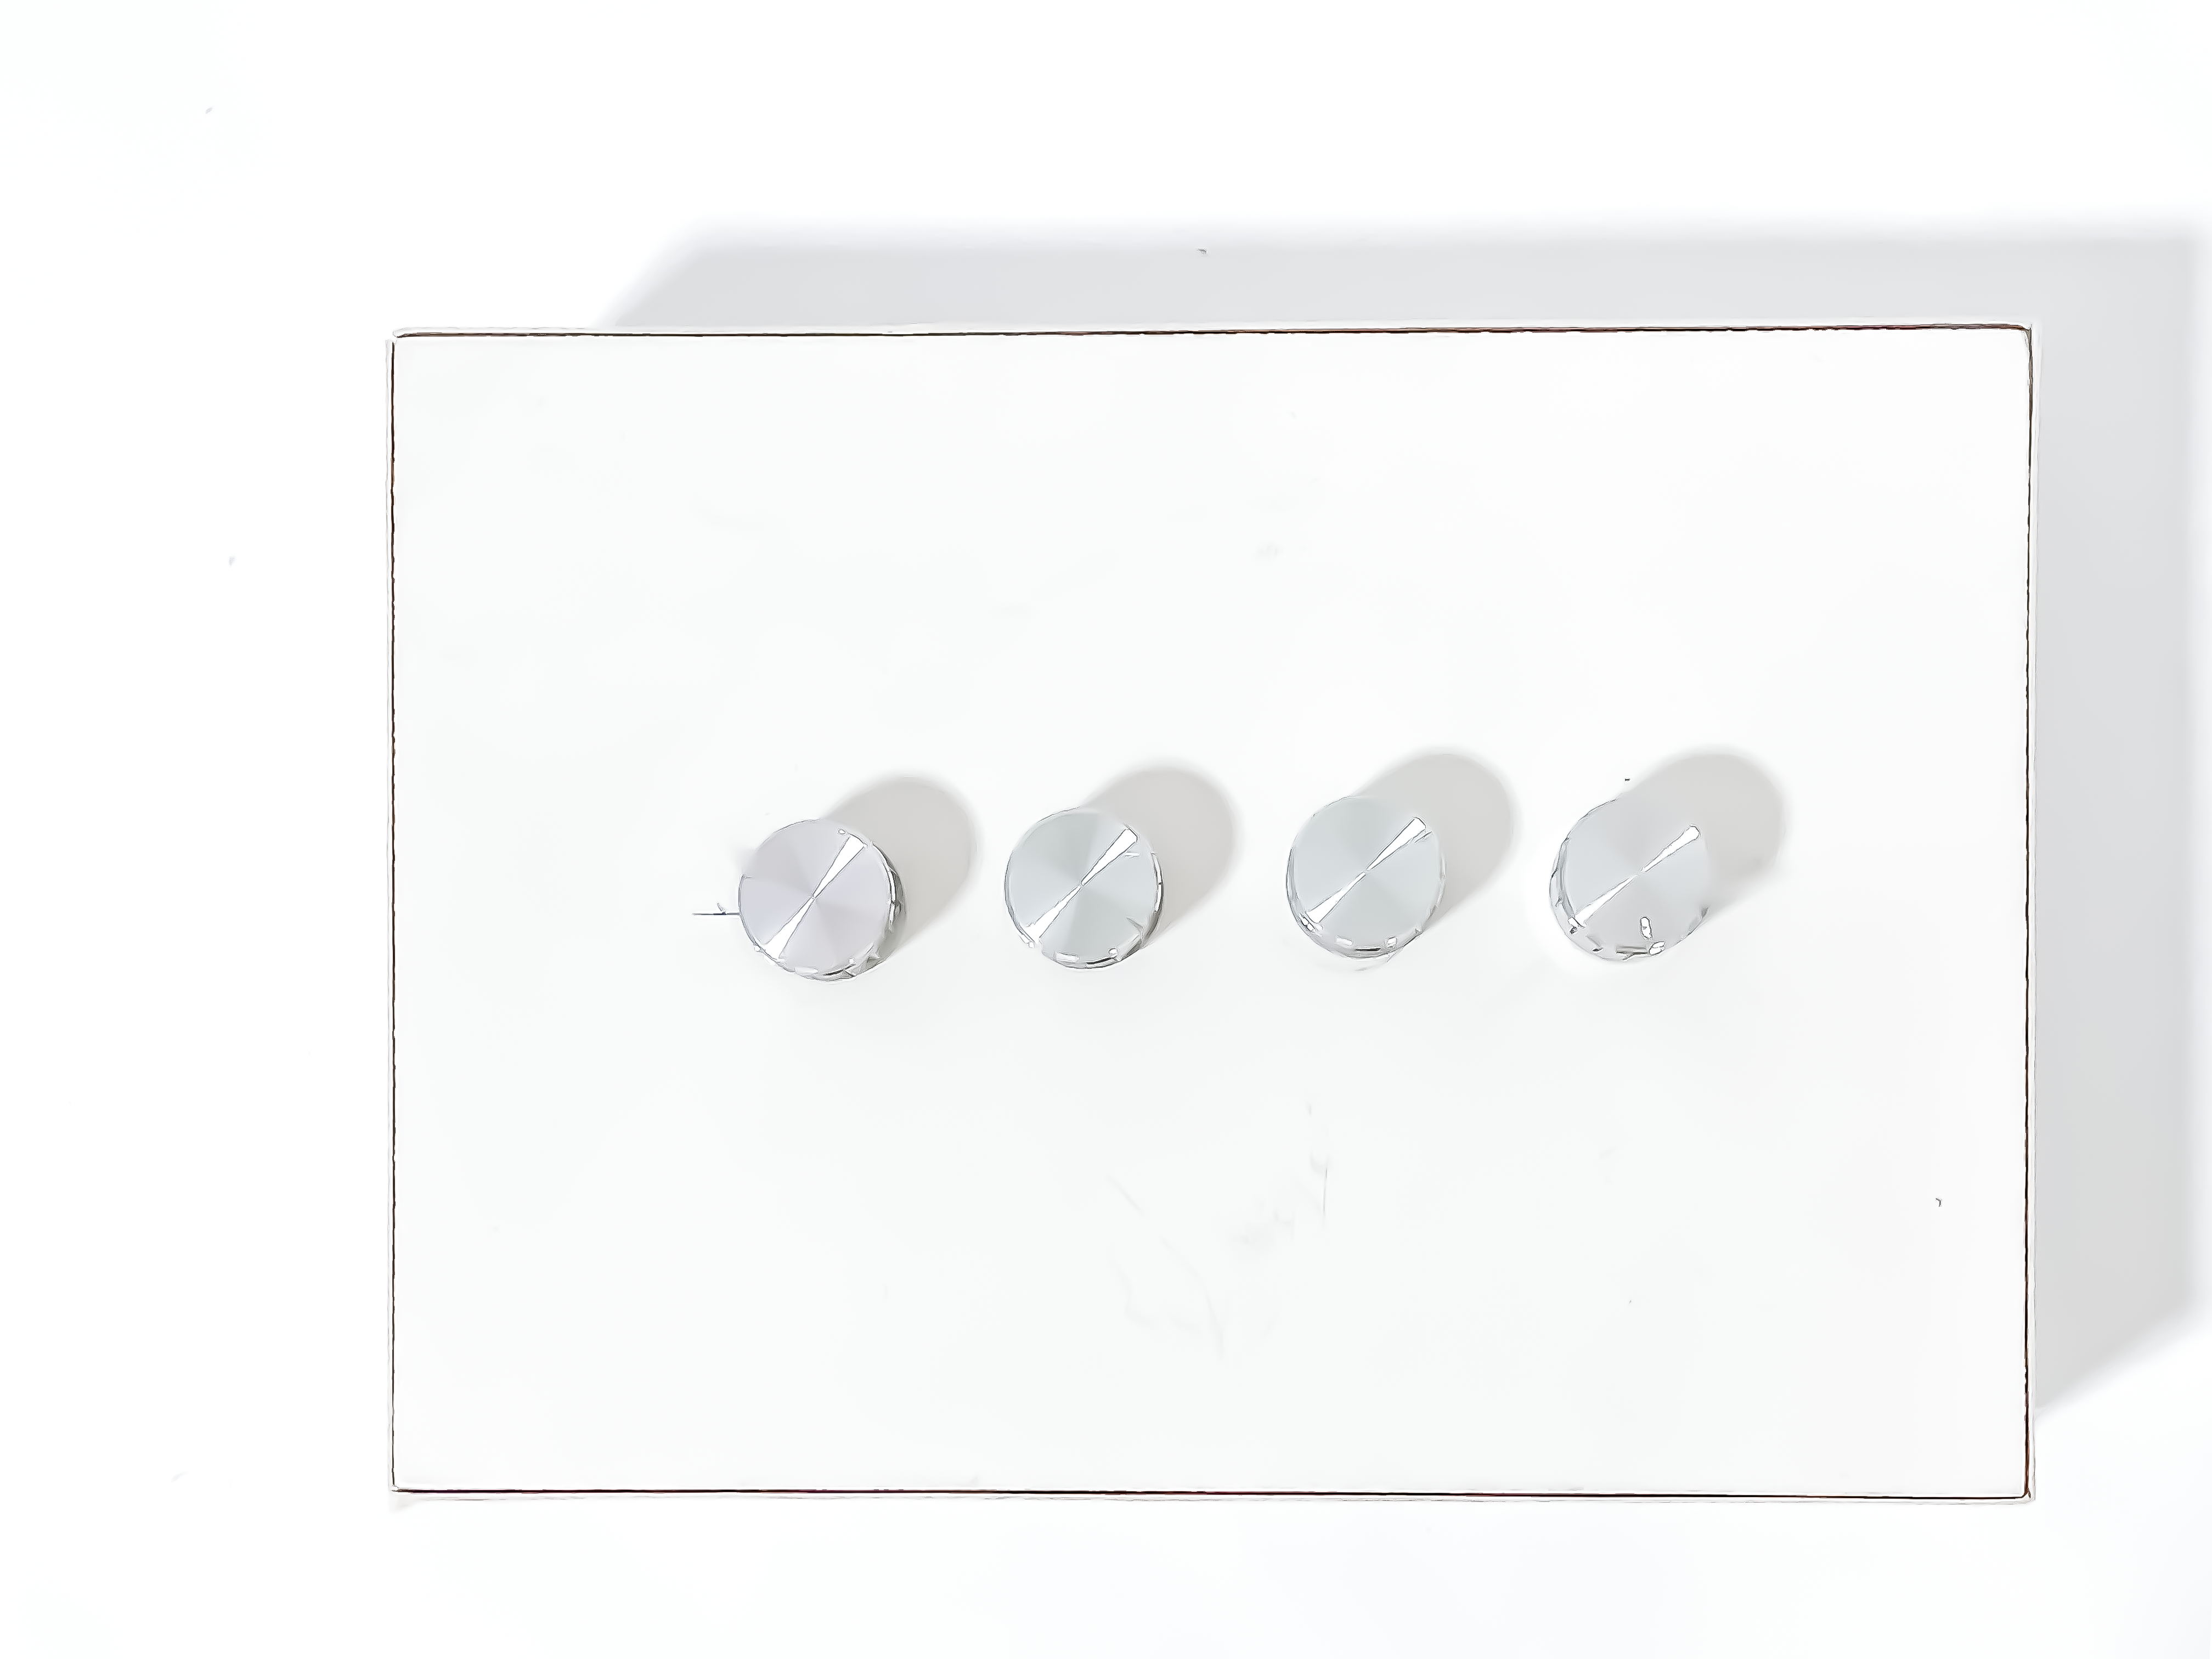

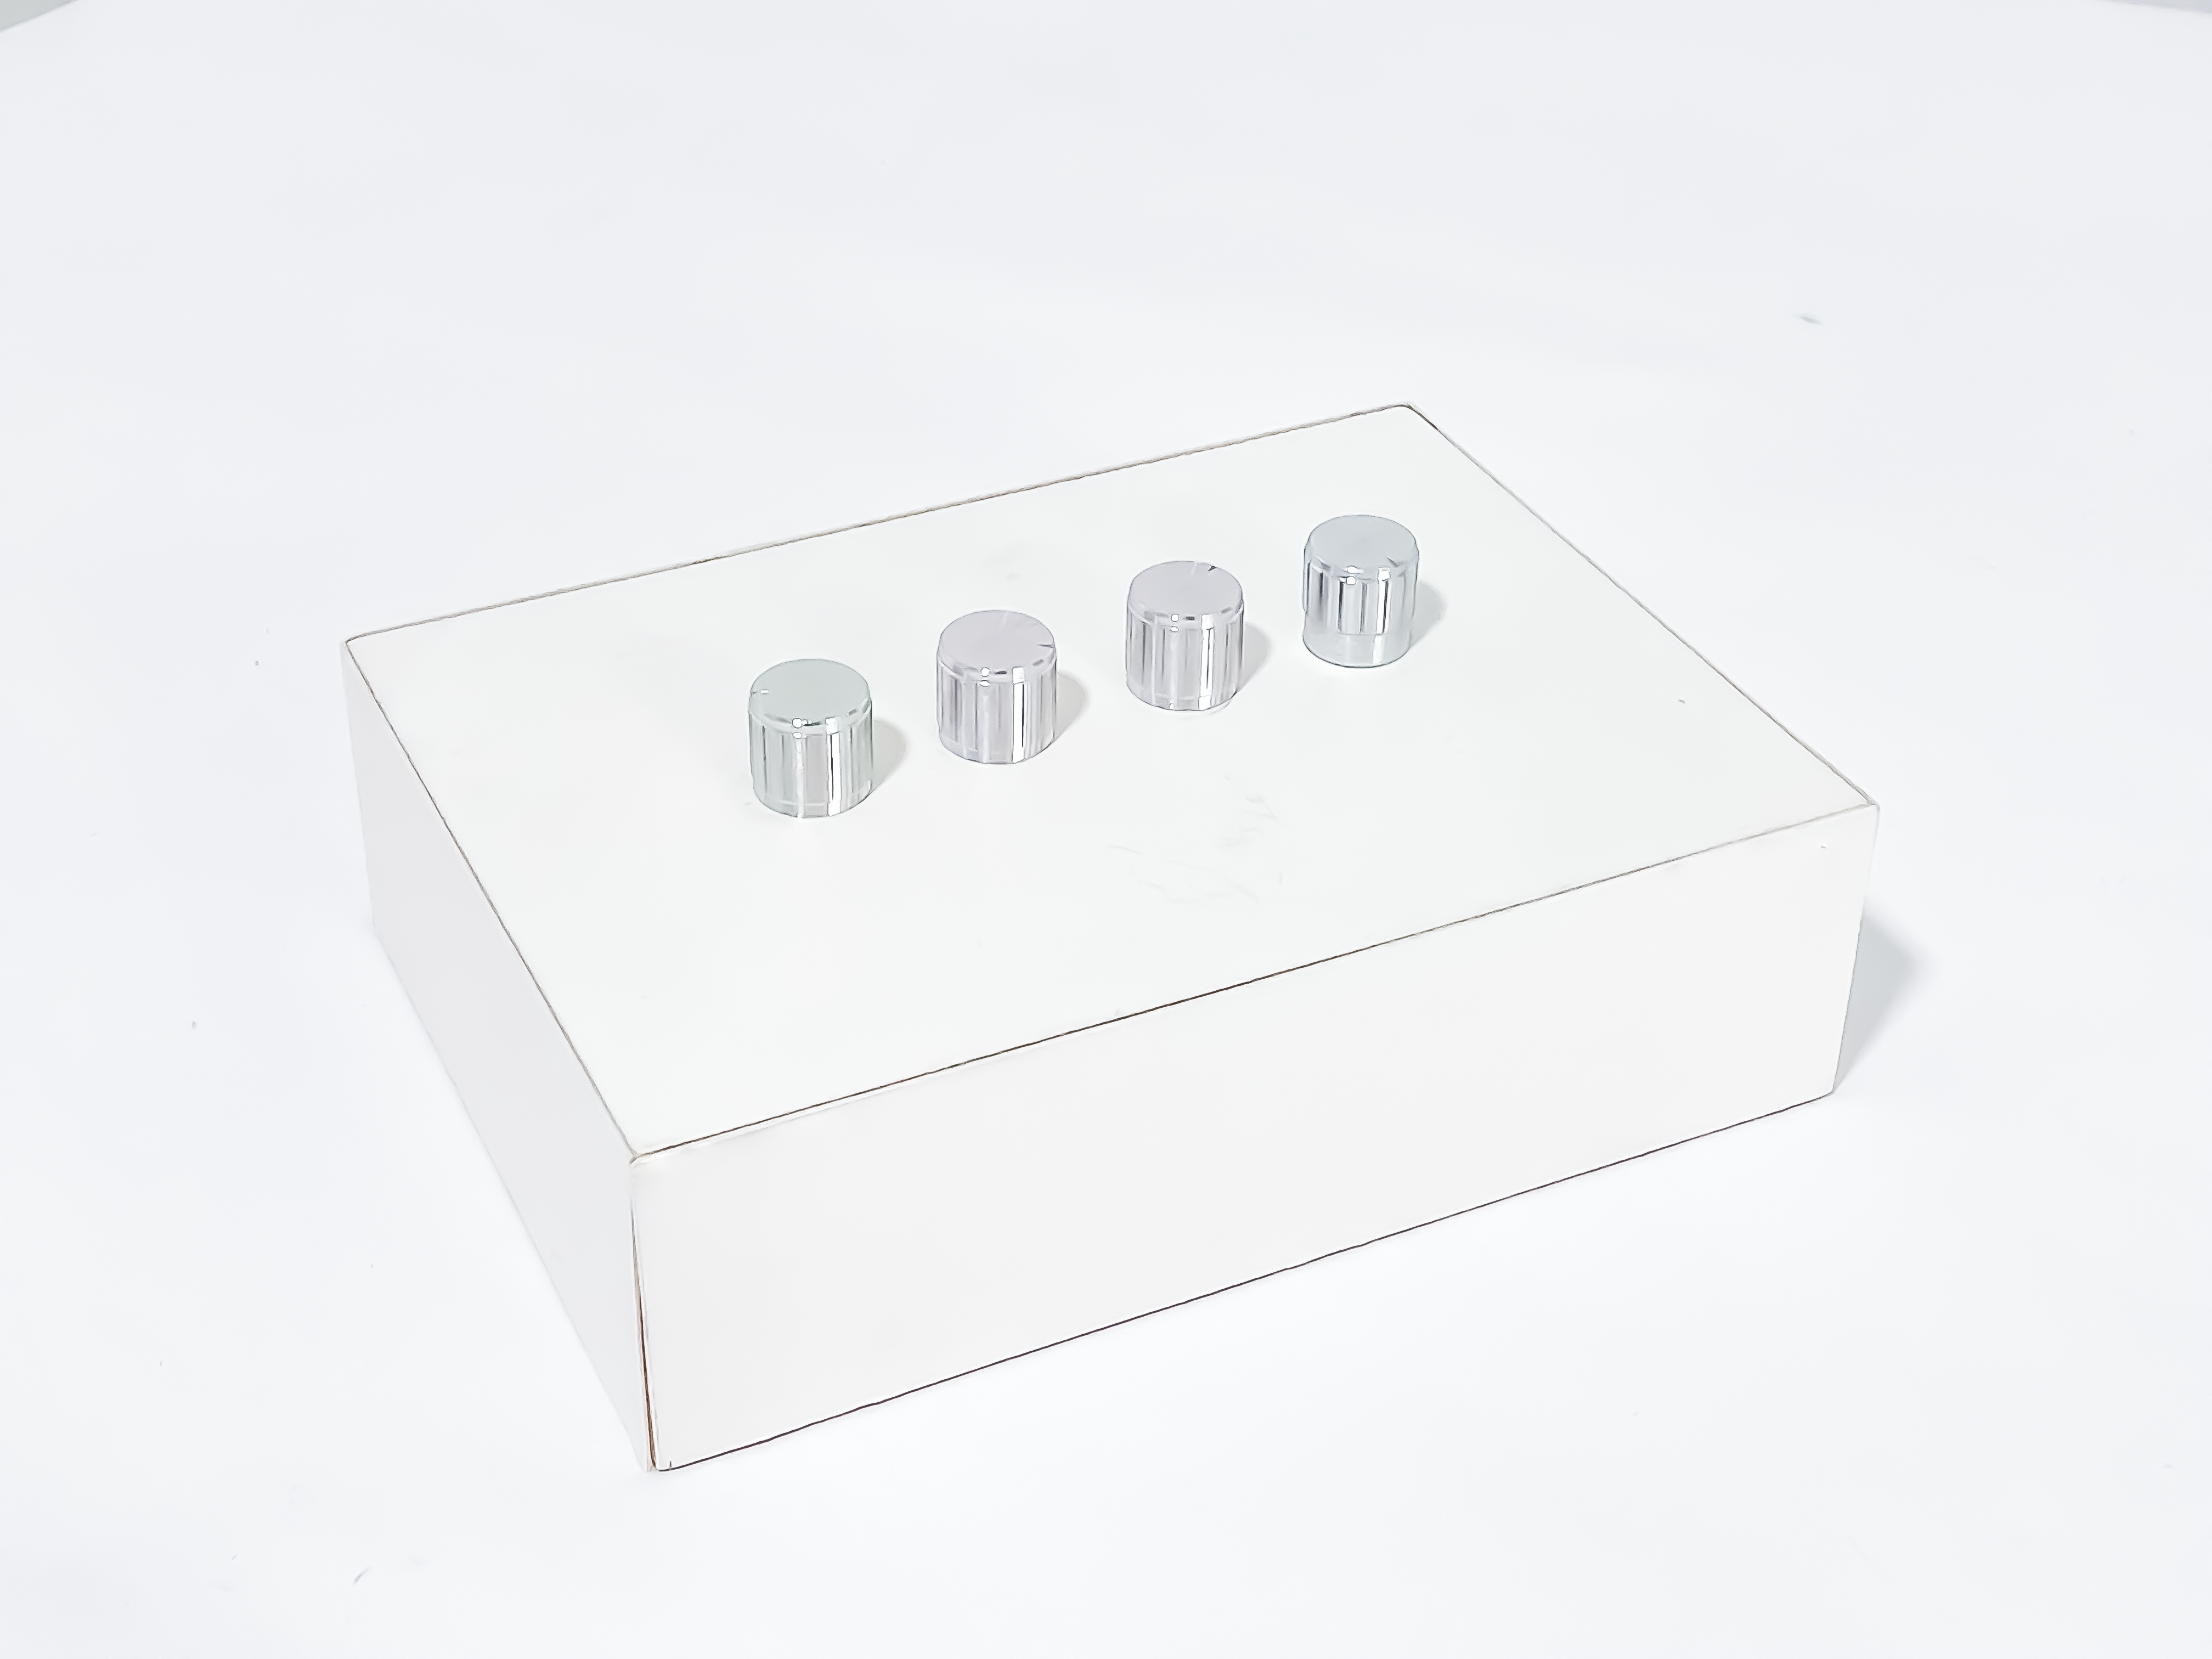
In the above set-up, a wooden artist gesso board was used to craft a packaging for the circuit and potentiometers. Wood was considered as a possible material as the material can be easily customised to fit the layout of the Arduino circuit, wiring of potentiometers and knobs. A 3–5mm electric drill was used to create holes on the surface of the wooden artist gesso board. The holes were then smoothened down to fit the size of the potentiometers. Taking into consideration the thickness of the wood, the potentiometer exposed over the surface required metal knobs above to elevate the user engagement and experience.