- SELFSCAPES
- PROTOTYPE
SELFSCAPES is the exploration of identity representation through the experimentation of identity tools that enhances the expression and perception of the self. The SELFSCAPES PROTOTYPES present users with a way of discovering new dimensions of their online identities through the visualisation of the unseeable qualities such as emotions and voices that make up our identities. SELFSCAPES PROTOTYPES equips users with interactive sensory artefacts that assists them in the process of constructing their identities through visual and audio cues.
SELFSCAPES
PROTOTYPE
SELFSCAPES is the exploration of identity representation through the experimentation of identity tools that enhances the expression and perception of the self. The SELFSCAPES PROTOTYPES present users with a way of discovering new dimensions of their online identities through the visualisation of the unseeable qualities such as emotions and voices that make up our identities. SELFSCAPES PROTOTYPES equips users with interactive sensory artefacts that assists them in the process of constructing their identities through visual and audio cues.
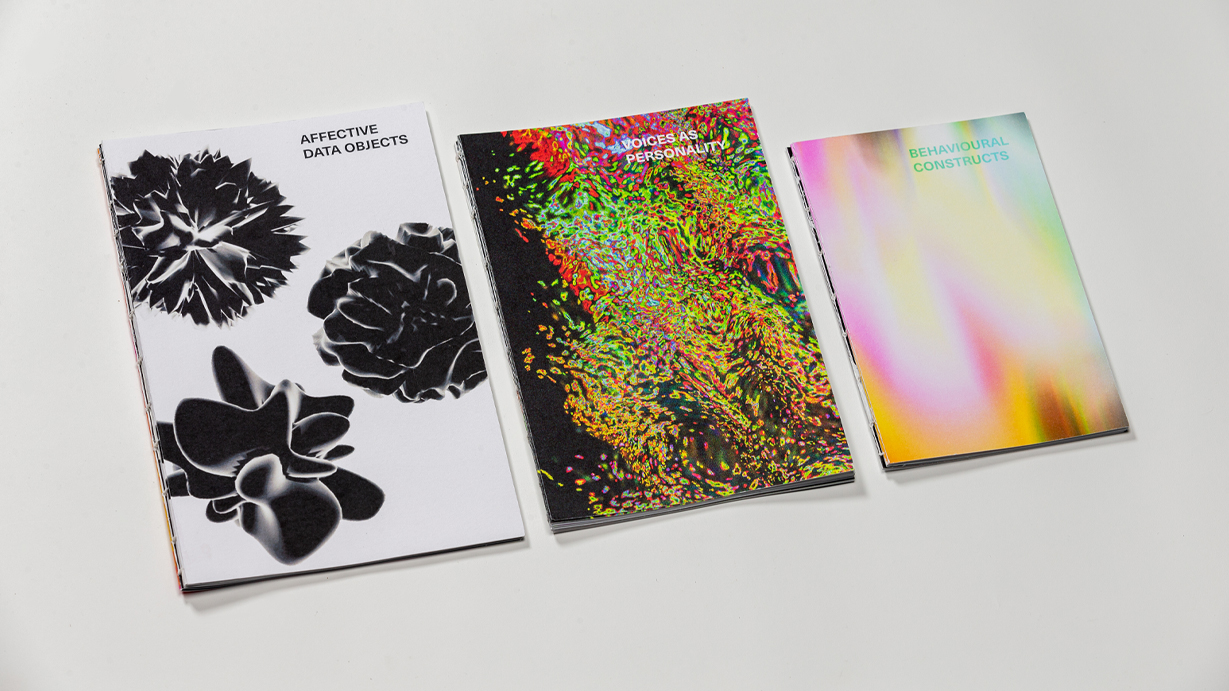
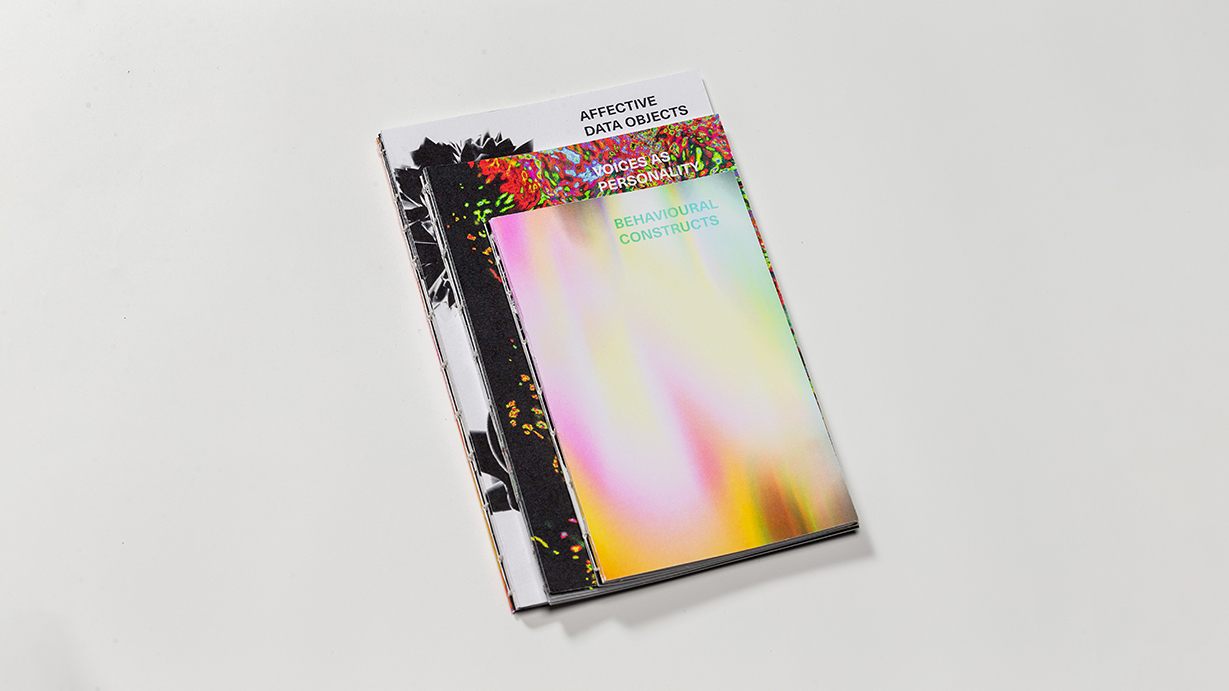
AFFECTIVE
DATA OBJECTS
AFFECTIVE
DATA OBJECTS


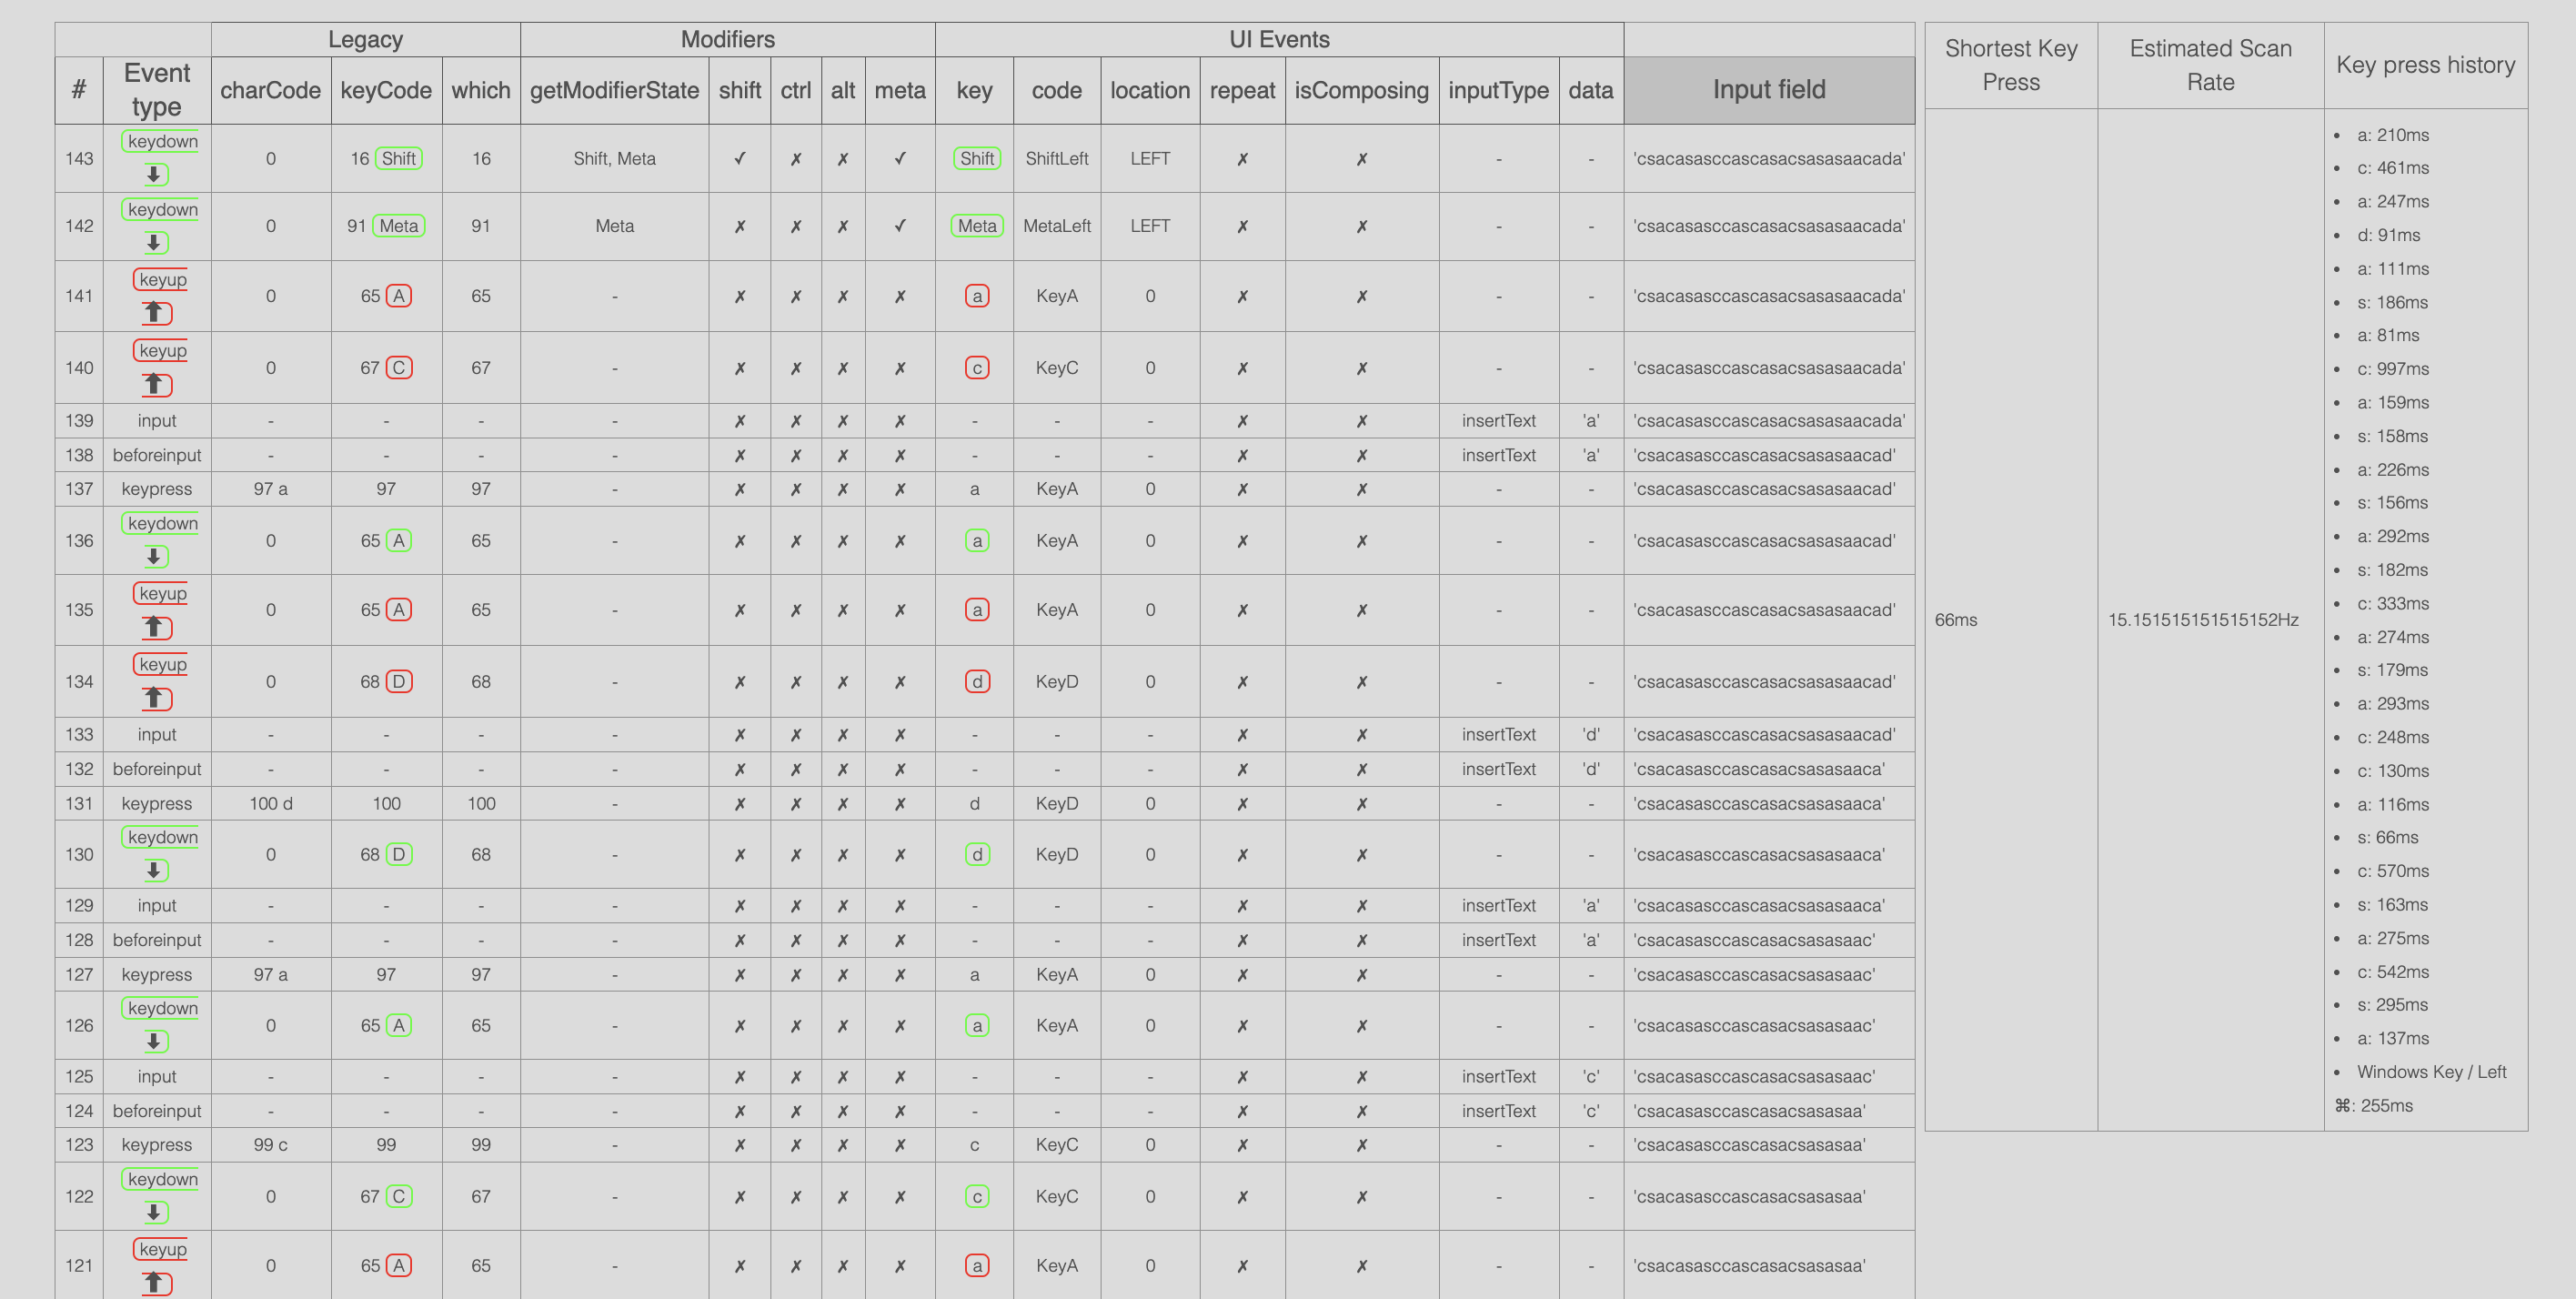
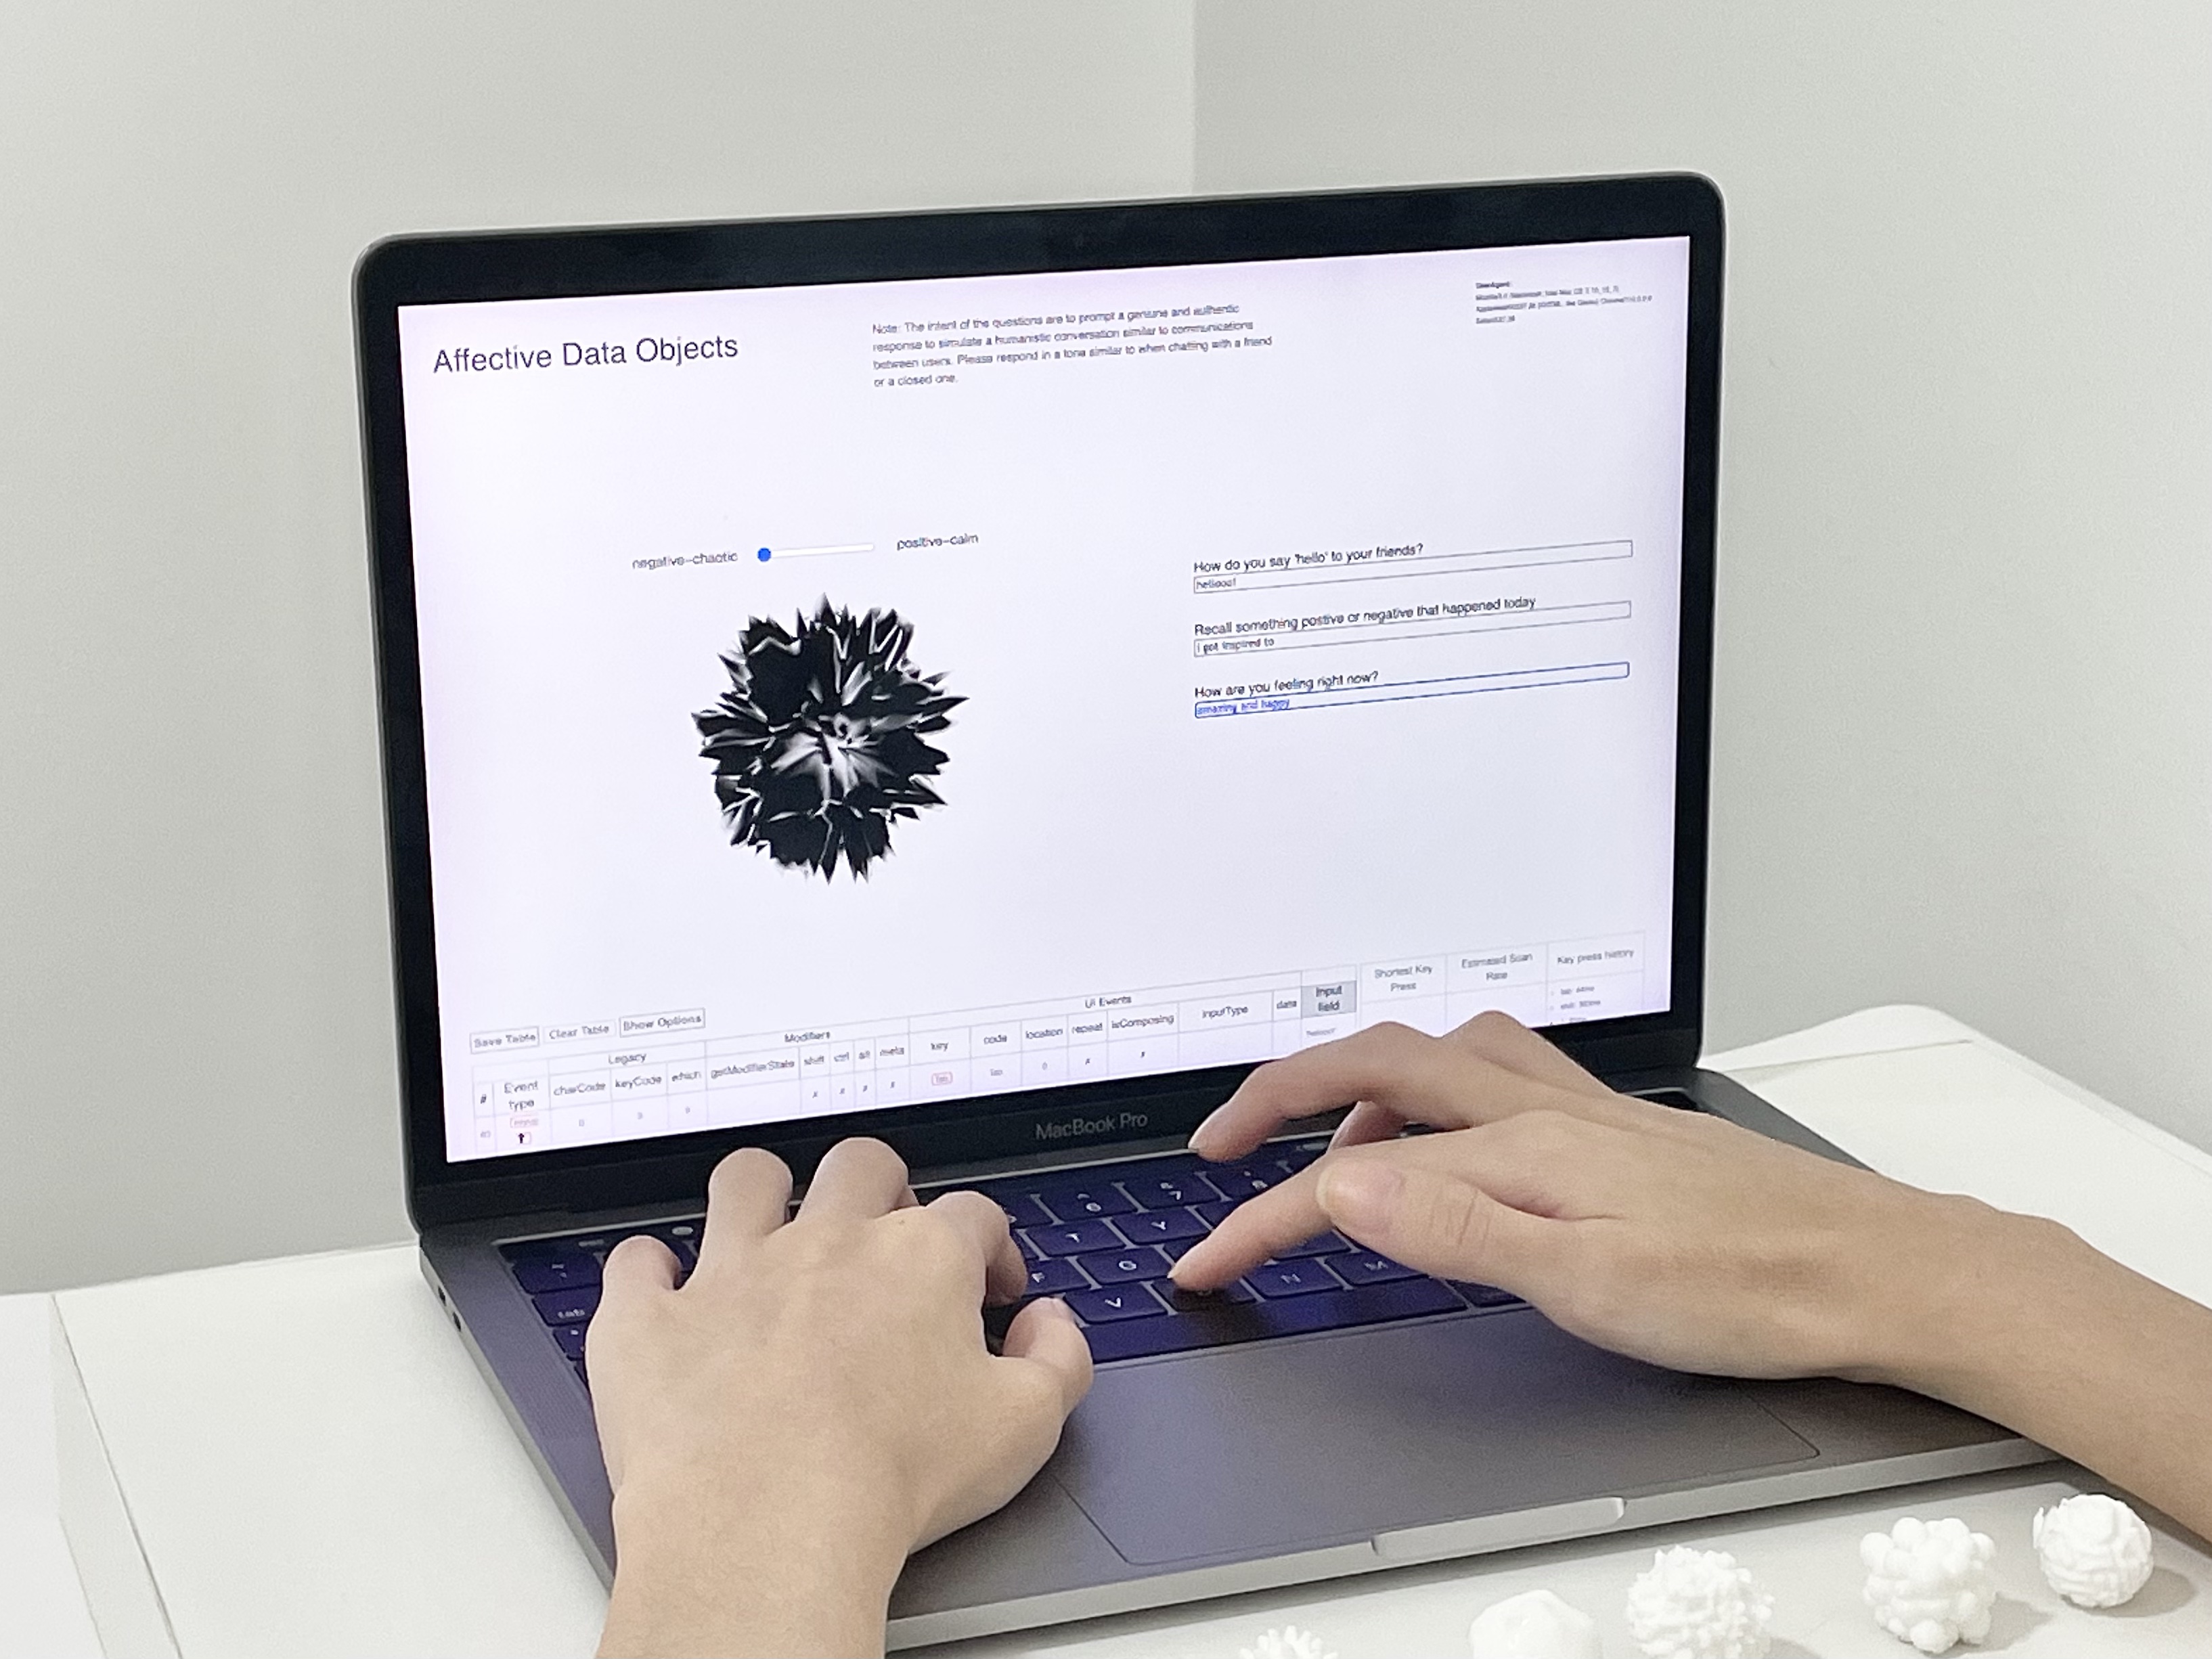
The first prototype examines the psychological influence of emotional states on the online behaviour of users through keystroke detection.


Coleman, Nicole, and Williams, Patti. “Feeling Like My Self: Emotion
Profiles and Social Identity”.
Journal of Consumer Research,
vol. 40, no. 2, 2013, pp. 203-222.
Hagger, Martin et. al.
“Aspects of identity and their influence on intentional behavior: Comparing effects for three health behaviors”. Personality and Individual Differences,
vol 42, no. 2, 2007, pp. 355-367.
Haque, Nazmul, and Alam, Jawal.
Identifying Emotion by Keystroke Dynamics And Text Pattern Analysis.
Islamic University of Technology (IUT),
2012, pp. 3-8.
Behaviour and emotions are central to the constructs of personal and social identities (Coleman 204). User behaviour and emotional states are two corresponding factors that are interdependent as emotions influence behaviour and actions. Consequently, behavioural changes occur when users shift between emotional states (Haque & Alam 8). The influence of human emotions greatly manipulates one’s actions and behaviours, which in turn reconfigures the identity of oneself. Hagger reiterates this by stating that higher levels of personal identity can be developed when one is driven by their feelings, attitudes, beliefs and behaviour (Hagger et al. 355).
The behaviour of typing on a keyboard presents a physical and psychological connection between the human body and the machine, allowing it to be a direct point of contact in translating the user’s emotion into the action of typing on a keyboard. For instance, the speed of typing has been proven to reflect the emotional valence of the user. Research on keystroke psychology have stated that users type slower while in a negative emotional state, and type faster when in a positive emotional state (Haque & Alam 8). As a result, this prototype utilises keystroke data as a way to detect behavioural changes in the analysis of emotional states.
Coleman, Nicole, and Williams, Patti. “Feeling Like My Self: Emotion
Profiles and Social Identity”.
Journal of Consumer Research,
vol. 40, no. 2, 2013, pp. 203-222.
Hagger, Martin et. al.
“Aspects of identity and their influence on intentional behavior: Comparing effects for three health behaviors”. Personality and Individual Differences,
vol 42, no. 2, 2007, pp. 355-367.
Haque, Nazmul, and Alam, Jawal.
Identifying Emotion by Keystroke Dynamics And Text Pattern Analysis.
Islamic University of Technology (IUT),
2012, pp. 3-8.


DATA COLLECTION
For this idea, data analysis will be performed on the keystroke dynamics of different participants. The typing pattern of users can be determined based on the keystroke rhythm and the repetition of unique keys (Vasyl et al. 918). Changes in time intervals and keys pressed can then be examined for behavioural changes. First to collect data on keystroke patterns, the interface is designed to mimic a messaging bot that will generate questions to simulate the flow of conversation between users. Keystroke data is then collected based on the typing behaviour when the user responds to the questions.
Vasyl, Alieksieiev, et al. “Web-based application to collect and analyze users data for keystroke biometric authentication”. 2017 IEEE First Ukraine Conference on Electrical and Computer Engineering (UKRCON), 2017, pp. 917-918.


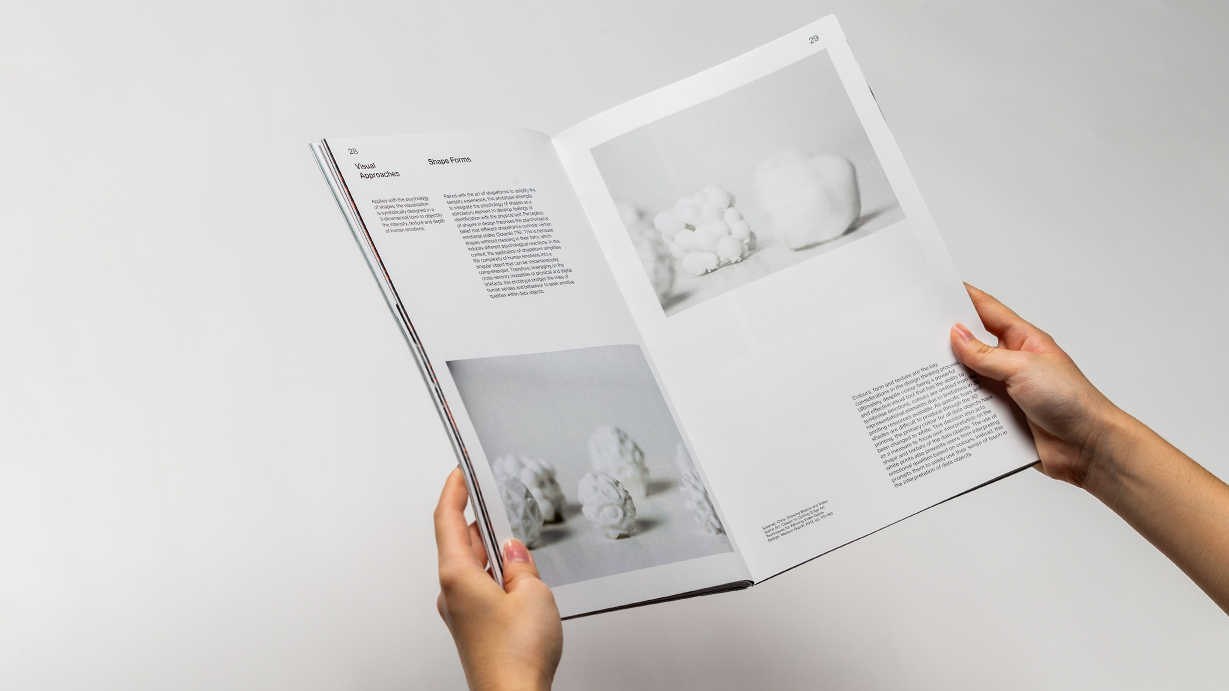
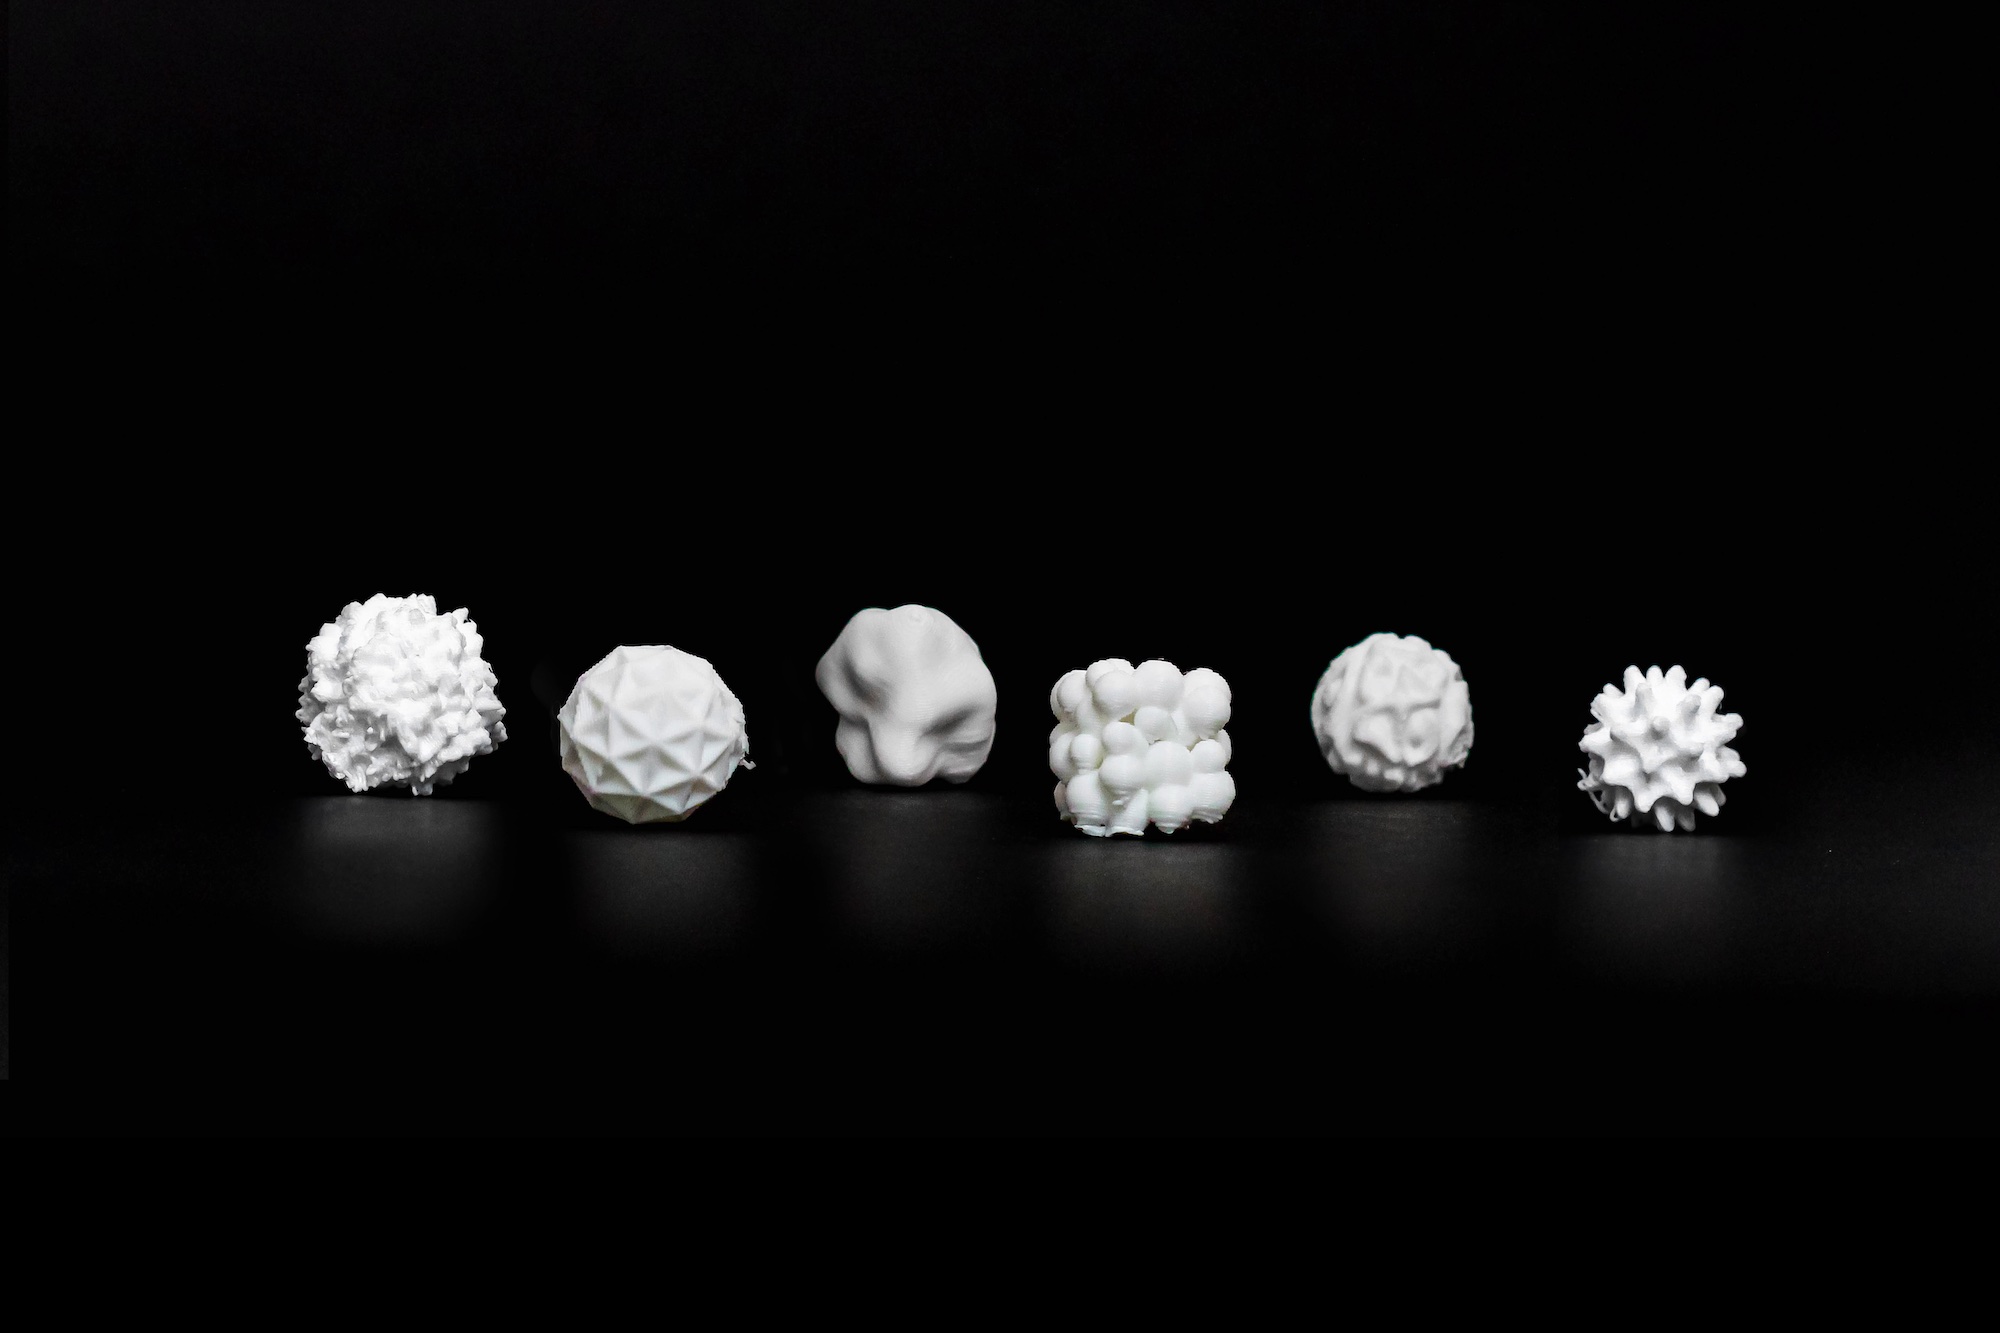
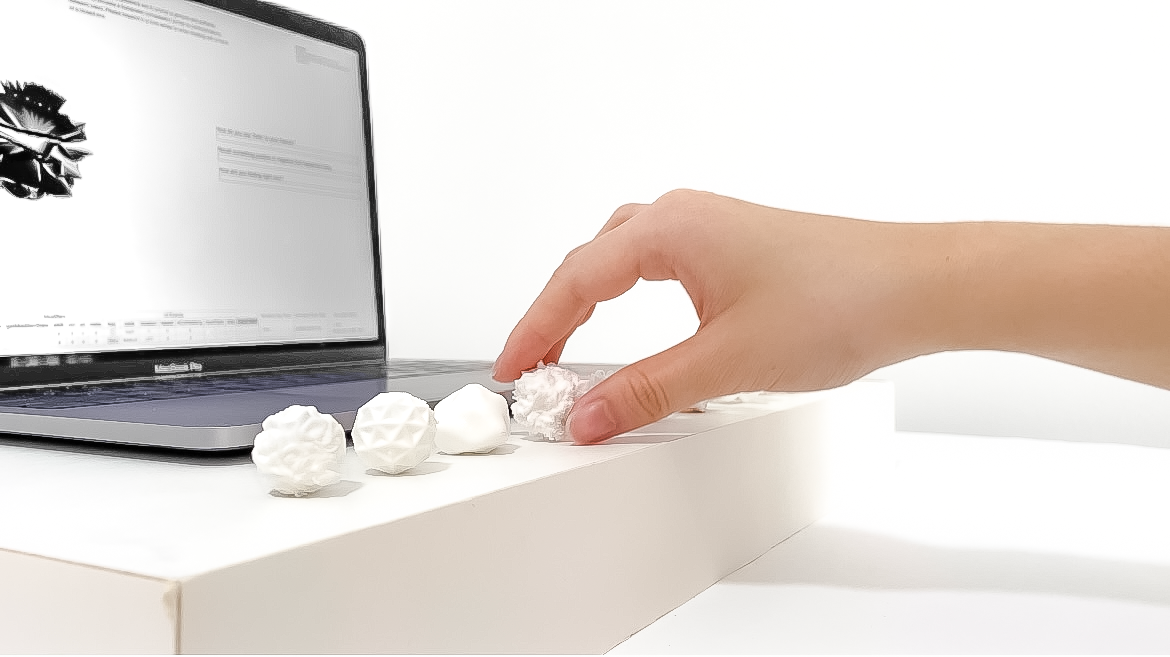
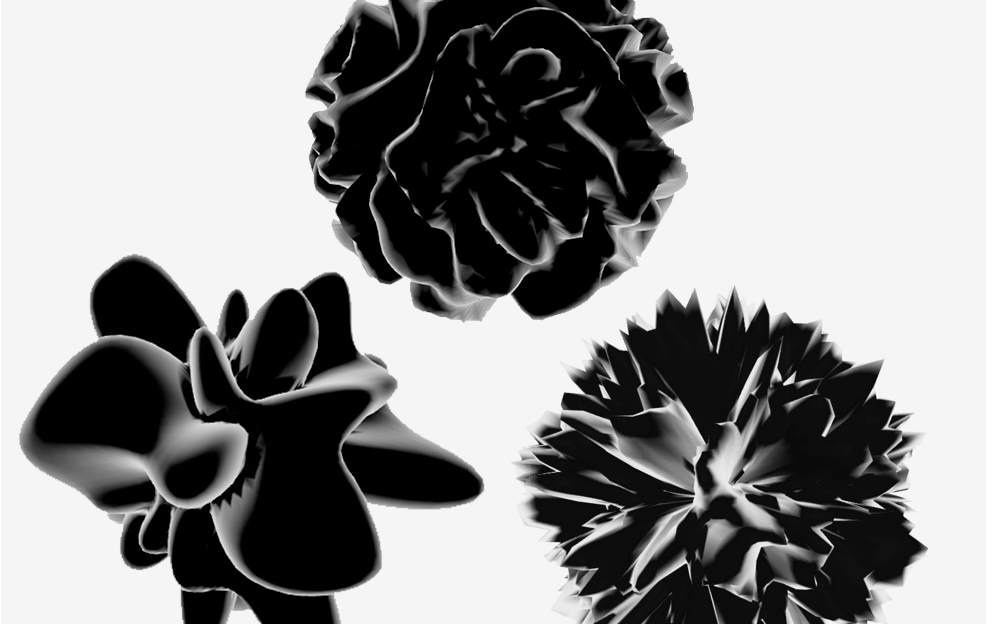
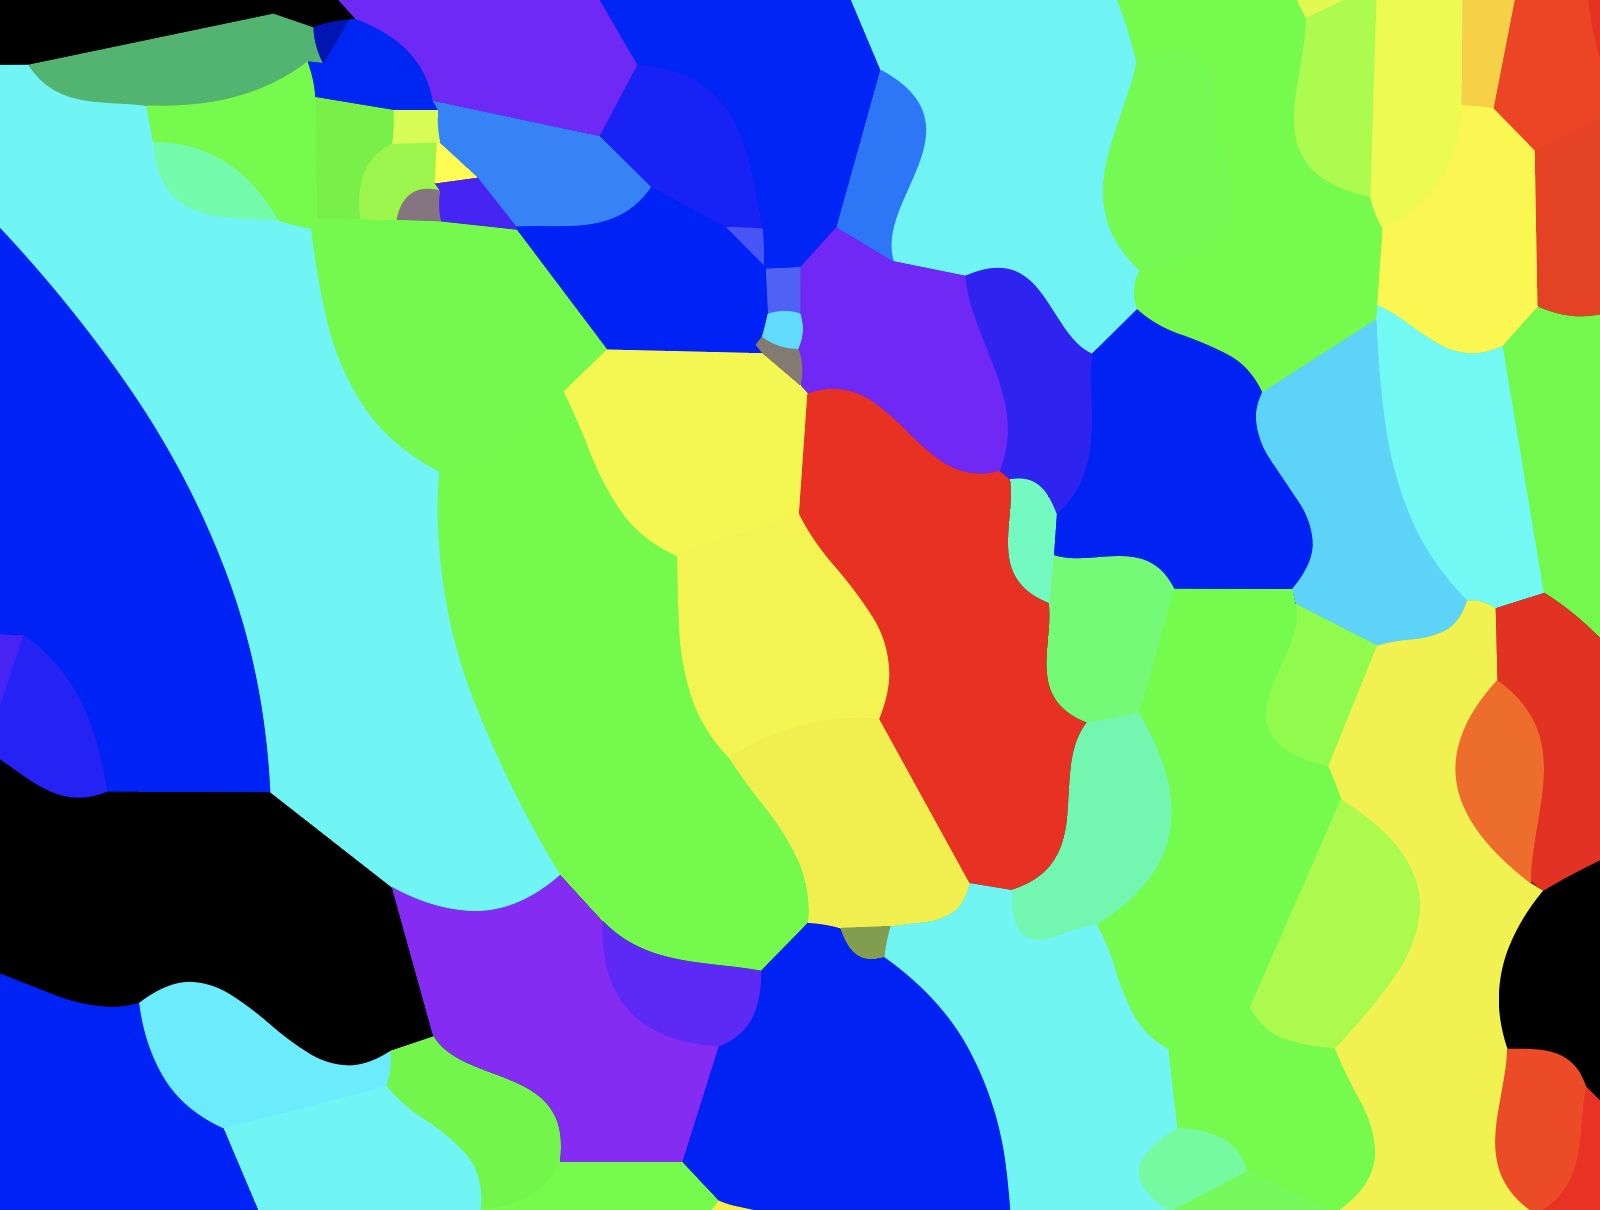
SHAPEFORMS
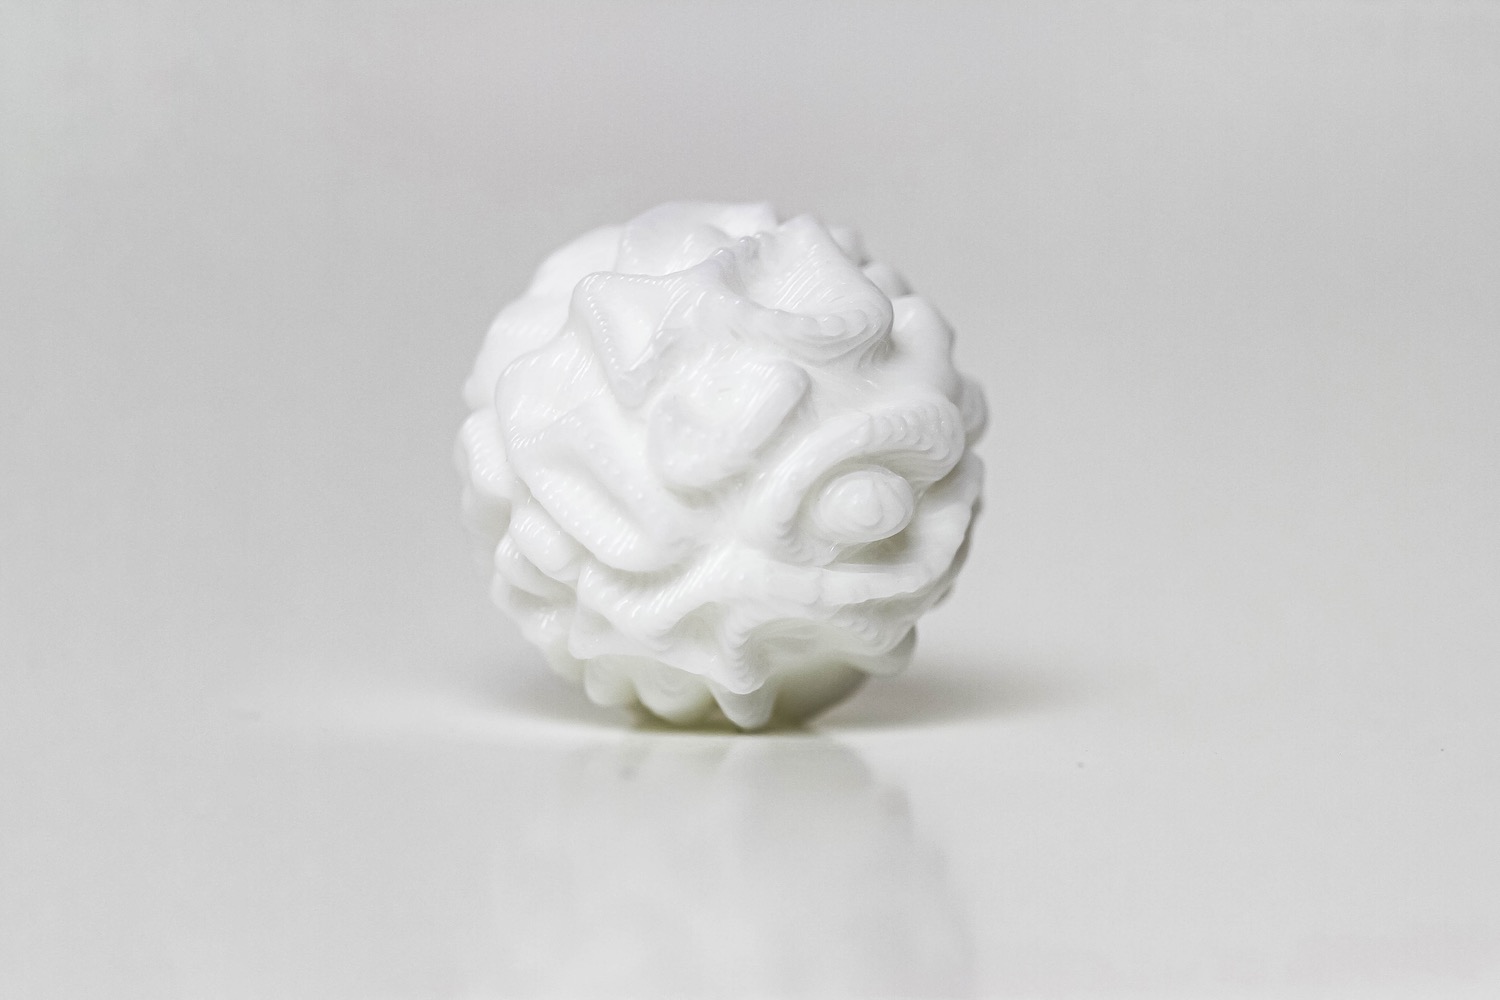
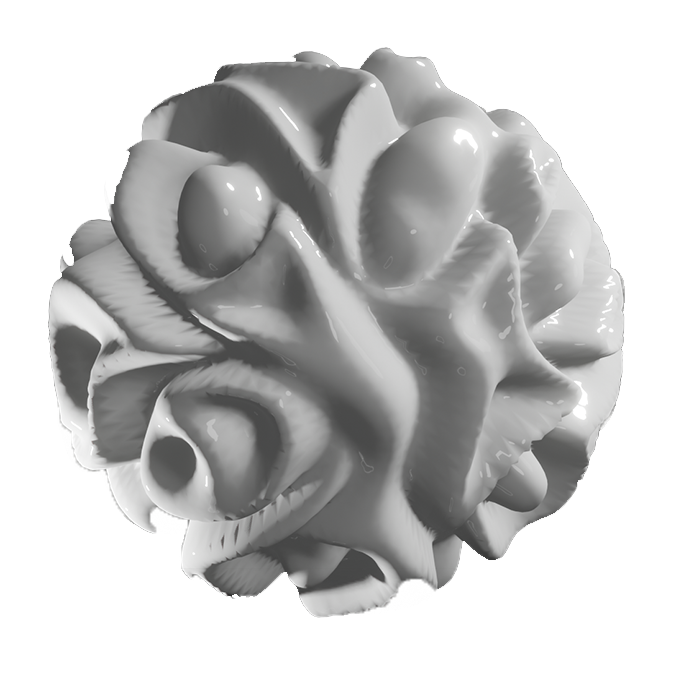
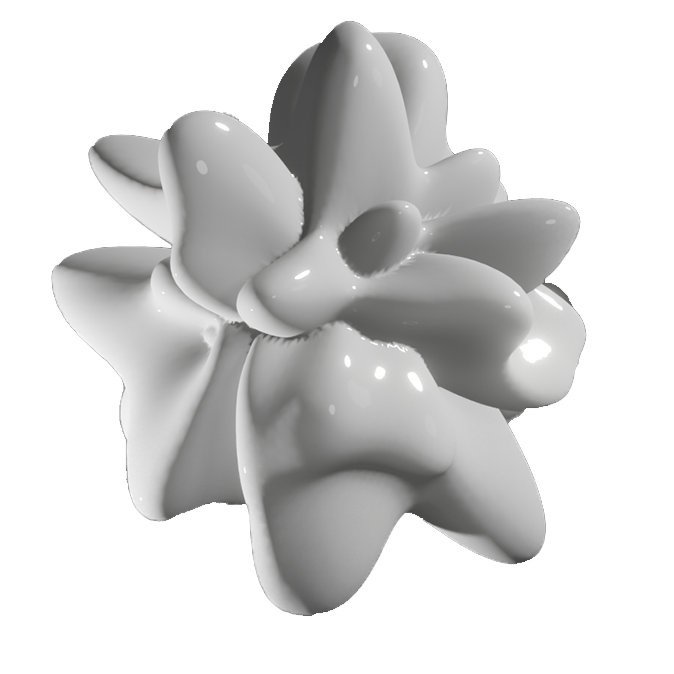
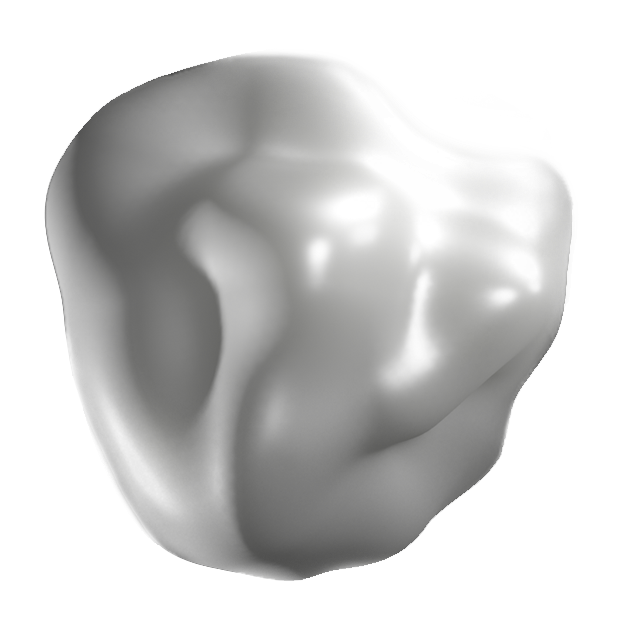
Applied with the psychology of shapes, the visualisation is symbolically designed in a 3-dimensional form to objectify the intensity, texture and depth of human emotions.
Paired with the art of shapeforms to amplify the sensory experience, this prototype attempts to integrate the psychology of shapes as a stimulatory element to develop feelings of identification with the physical self. Perception of shapes in design theorises the psychological belief that different shapeforms connote certain emotional states (Solarski 176). This is because shapes withhold meaning in their form, which induces different psychological reactions. In this context, the application of shapeform simplifies the complexity of human emotions into a singular object that can be instantaneously comprehended. Therefore, leveraging on the cross-sensory modalities of physical and digital artefacts, this prototype bridges the roles of human senses and behaviour to seek emotive qualities within data objects.
Solarski, Chris. Drawing Basics and Video Game Art: Classic to Cutting-Edge Art Techniques for Winning Video Game Design. Watson-Guptill, 2012, pp. 170-180.


COMPLEXITY
IN TEXTURES
COMPLEXITY
IN TEXTURES


Emotional states are divided into two categories–emotional valence and emotional complexity. By synthesising the qualities of both emotional valence and emotional complexity, the state of users’ emotions can be determined.
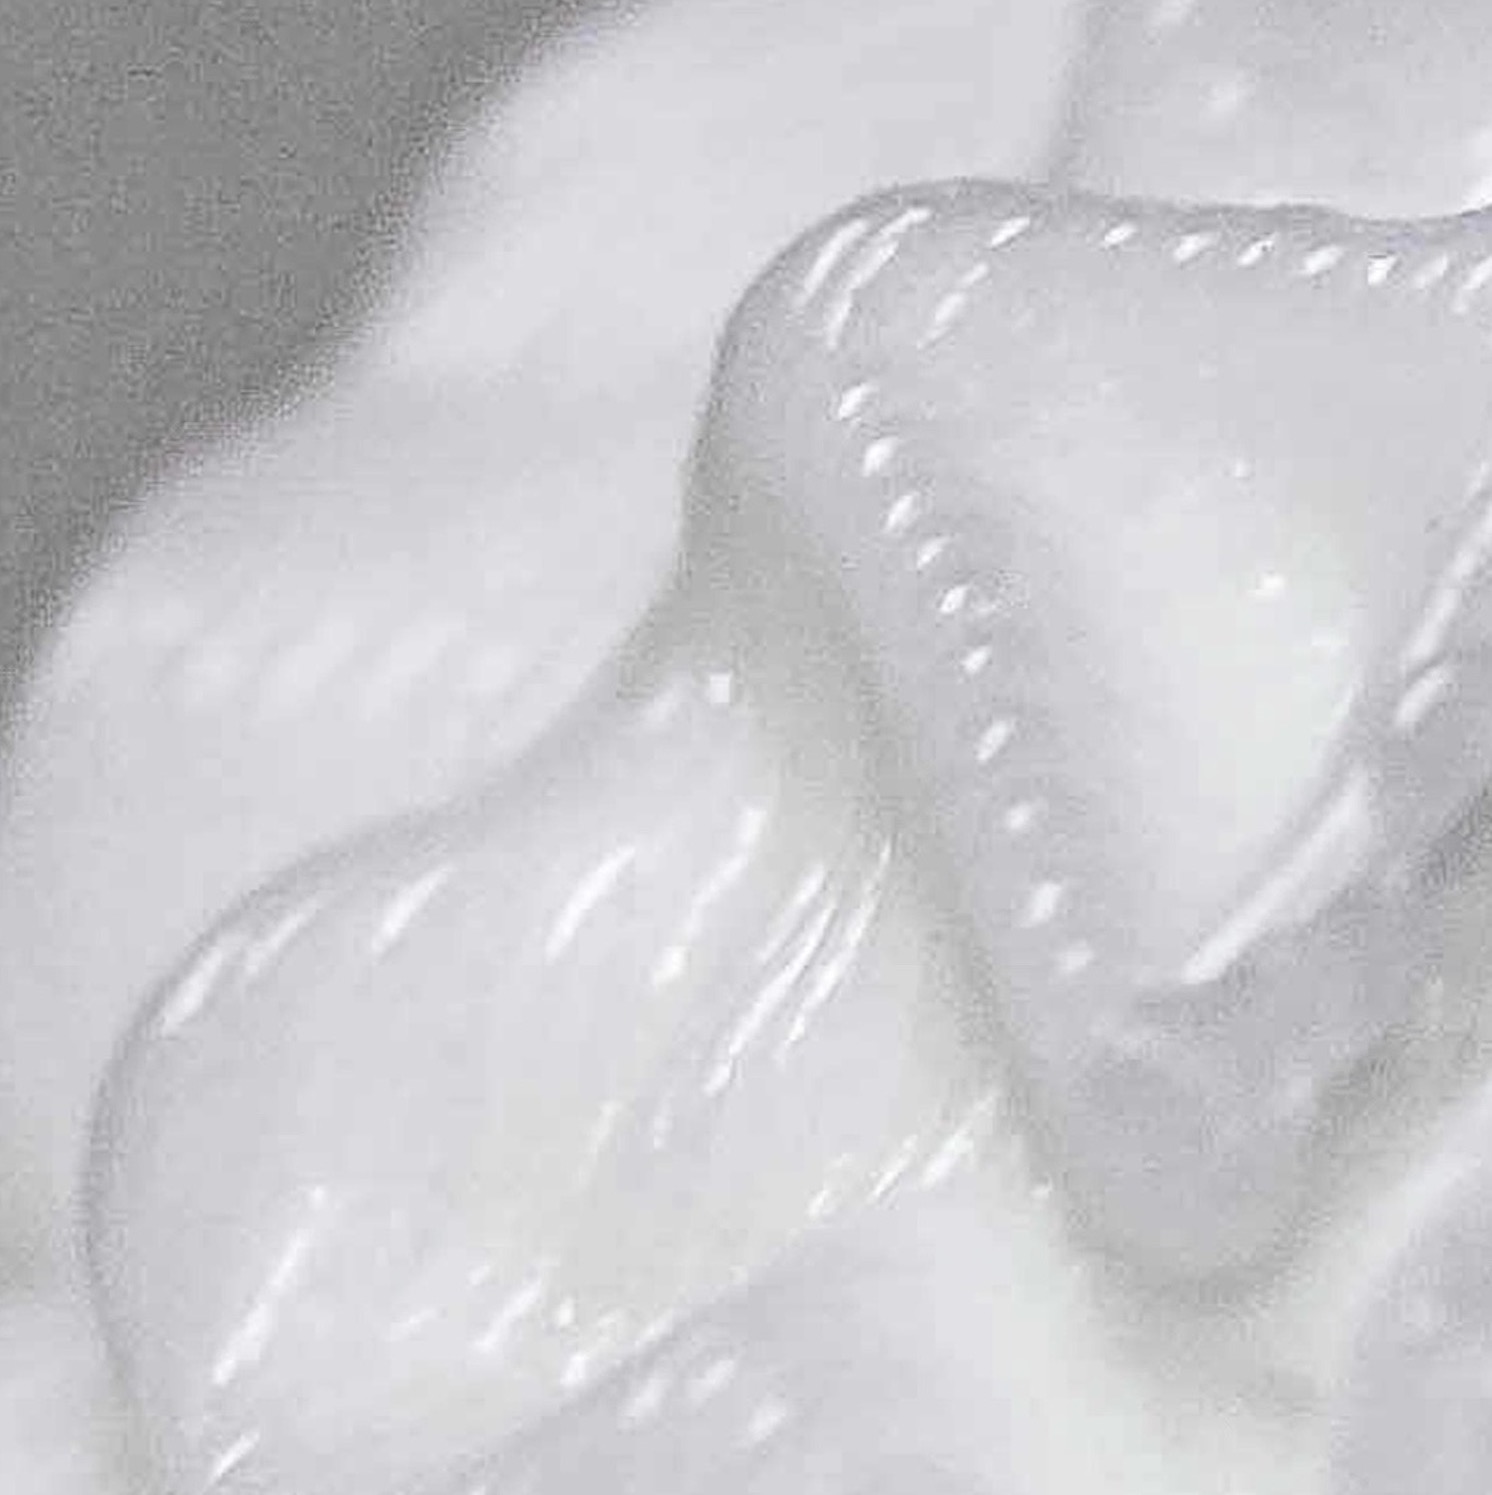
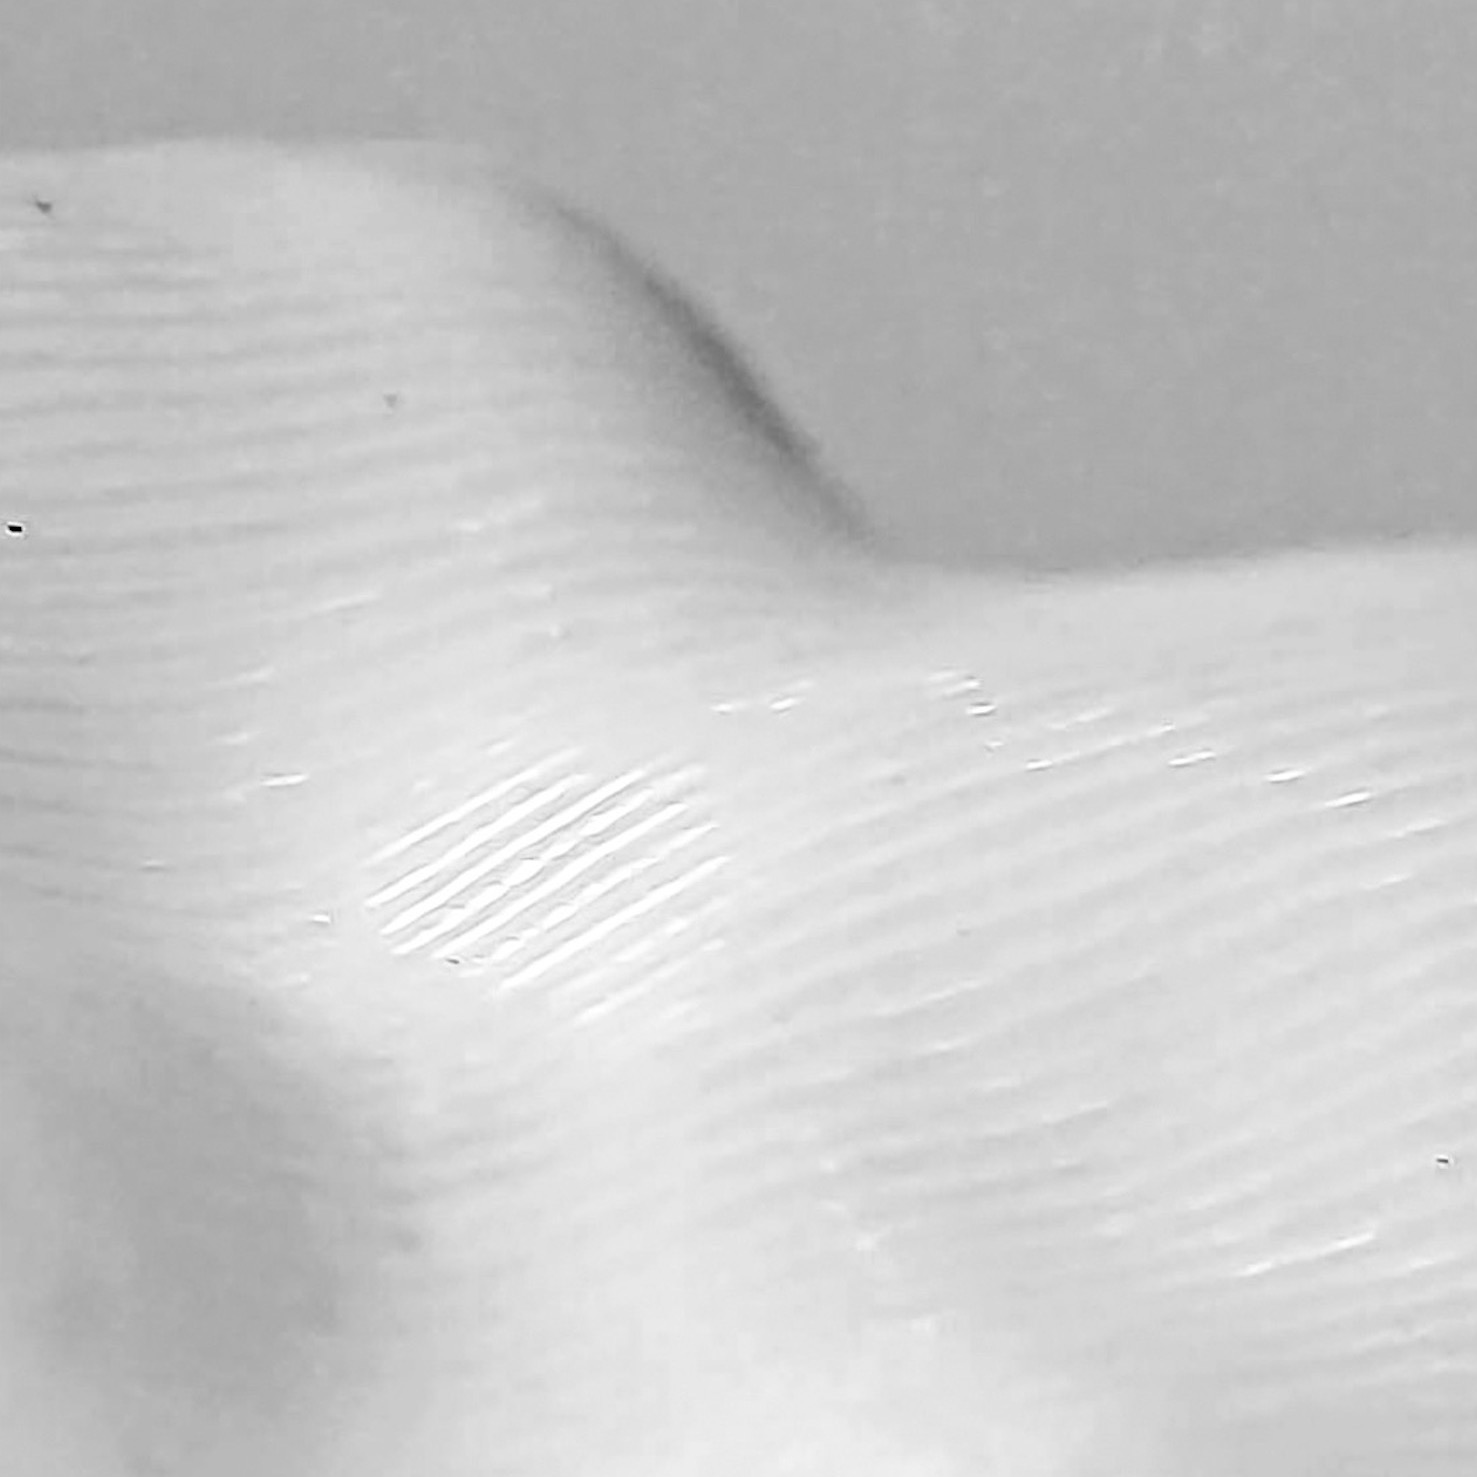
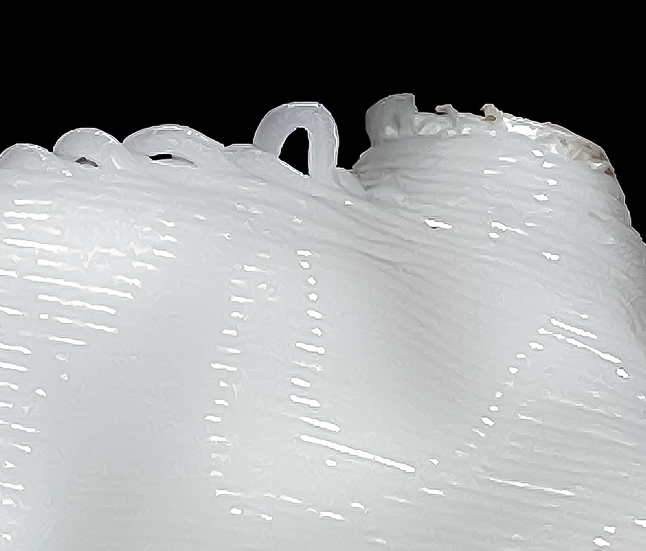
Similar to the aforementioned psychology of shapes theory, textures take on the same approach and method in its interpretation. Textures provide an added layer to the representational abilities of the data object. Textures can be interpreted through the sense of touch or act as a visual stimulus. Texture withholds overwhelming potential in creating opportunities for symbolism. Textures can be interpreted by itself or complement a shape form by manipulating the appearance and feel of the data object.
Sense of touch is used as the primary receptor to feel the complexity of different data objects in a 3-dimensional form. The tactile experiences of each data object physically and sensorially connect participants with the prototype, integrating a higher overall sense of identification.

INDEX OF
OBJECTS
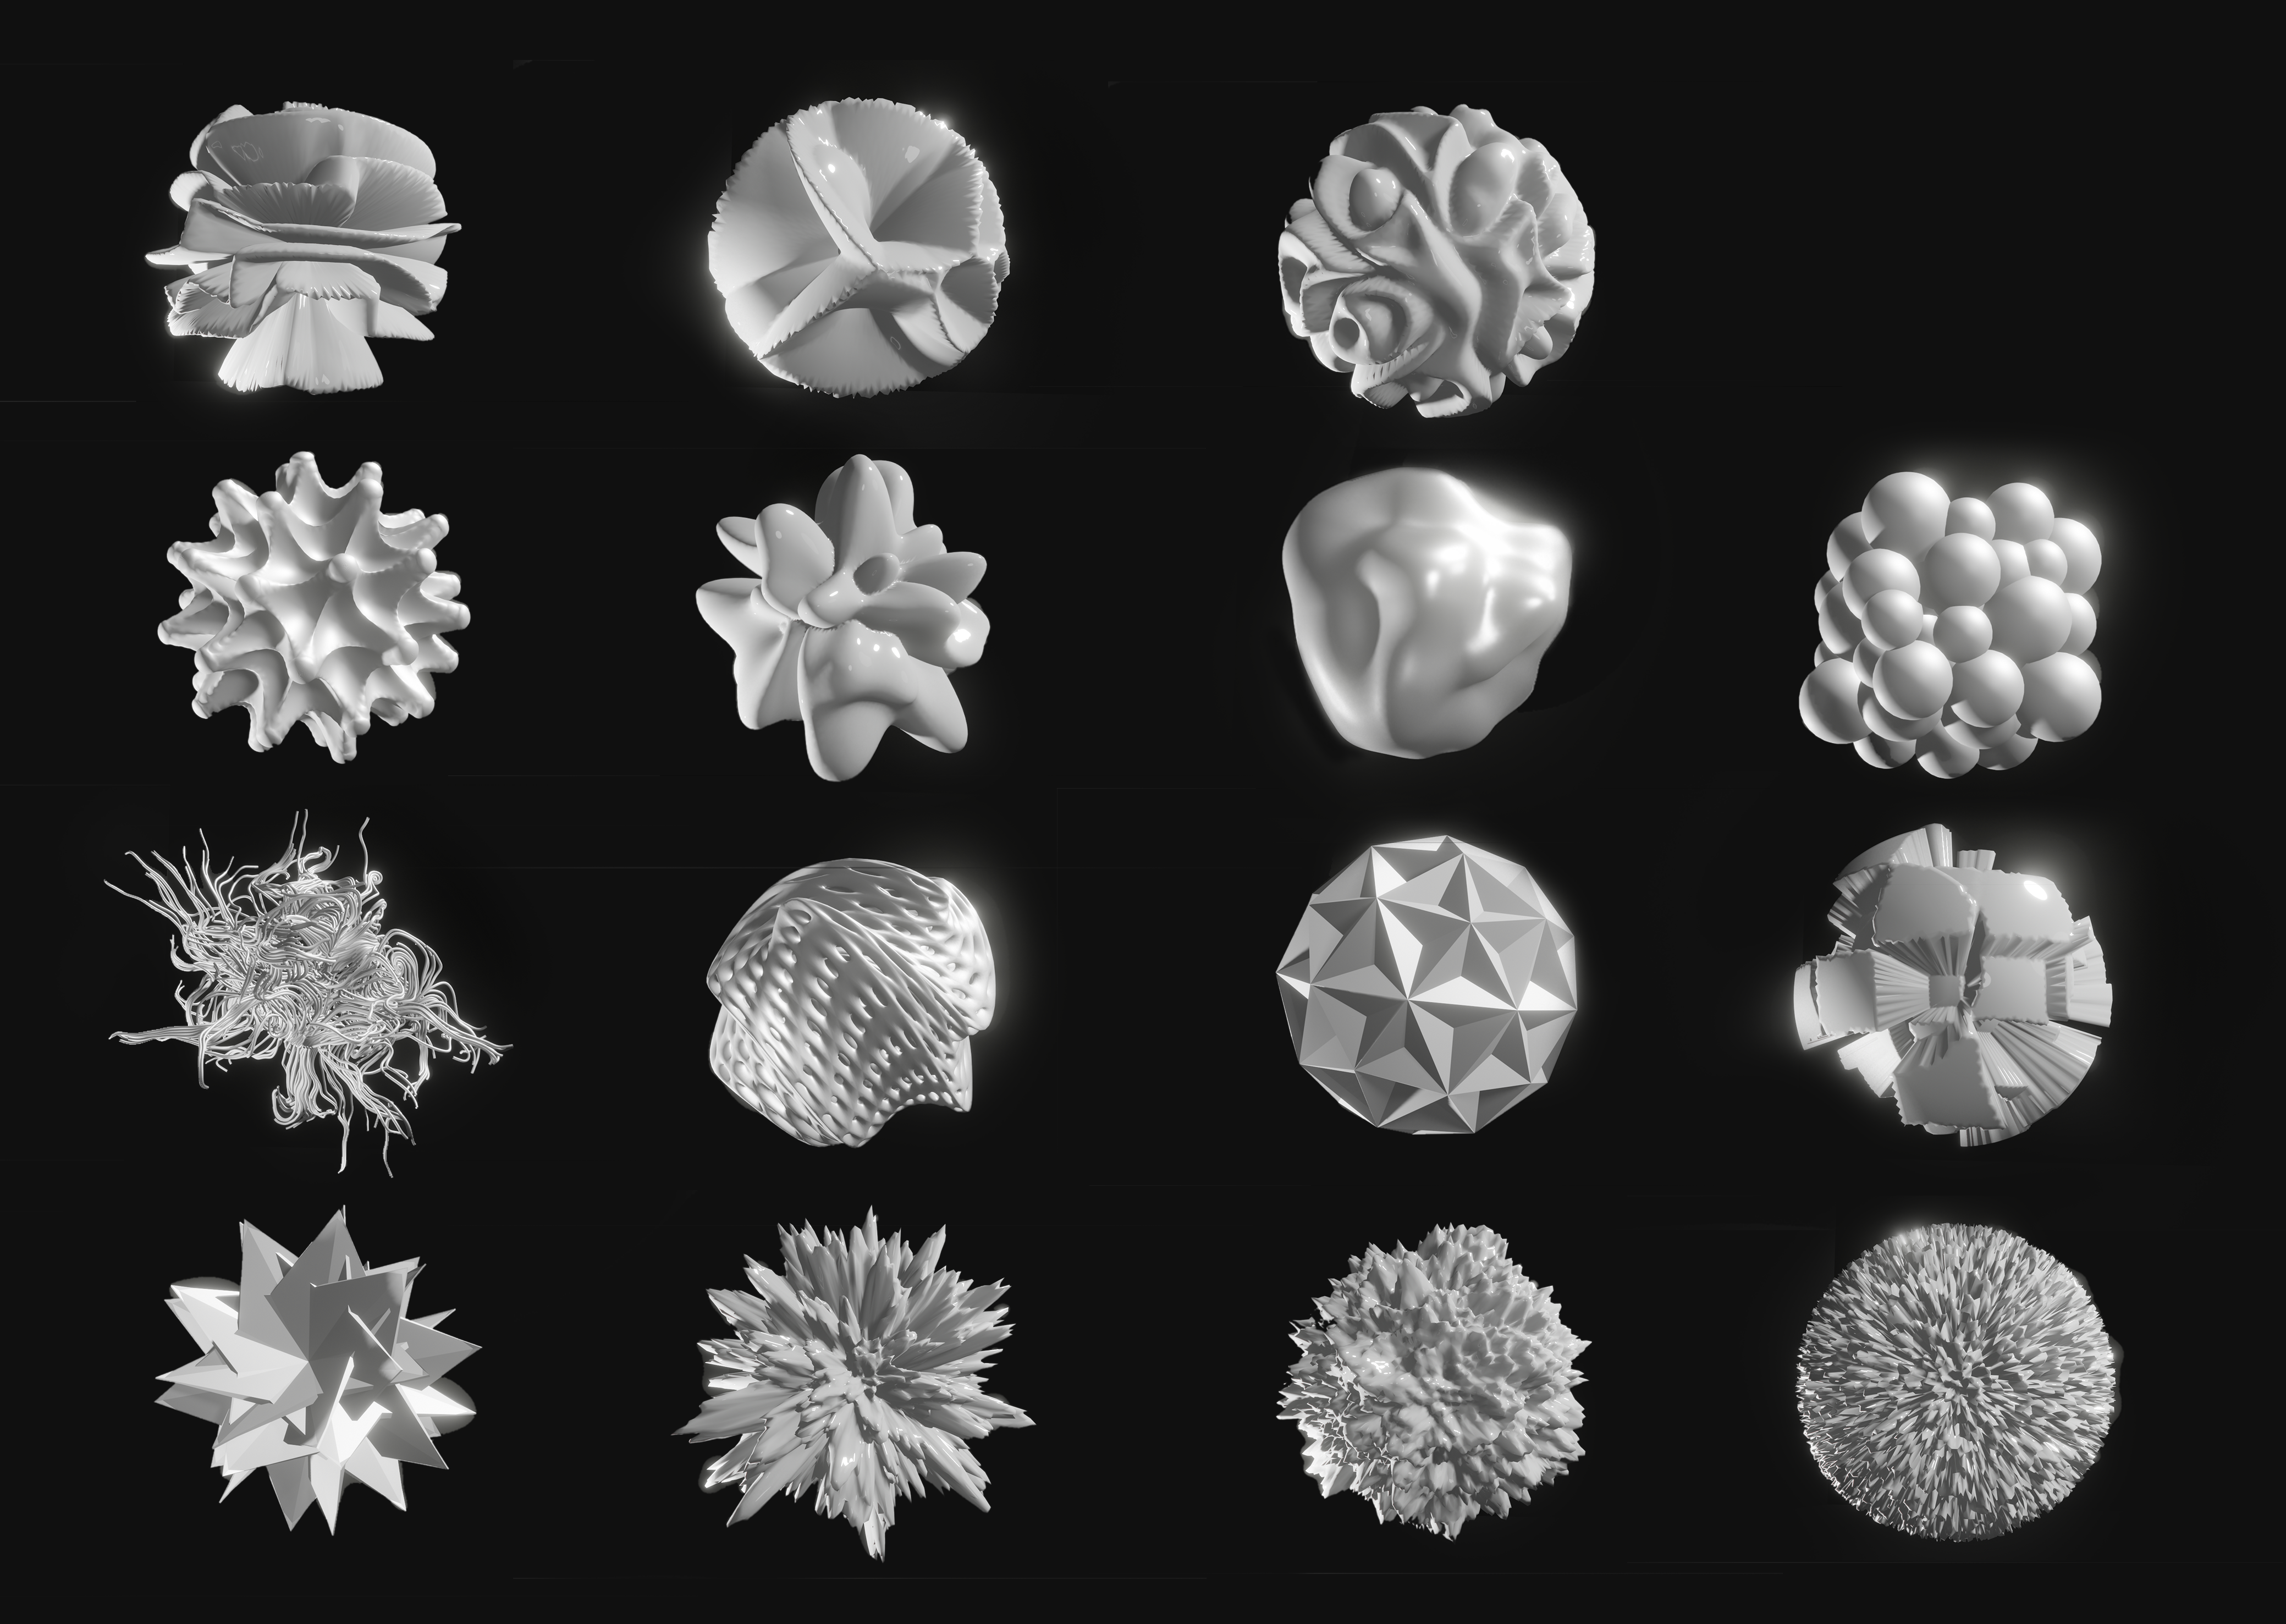
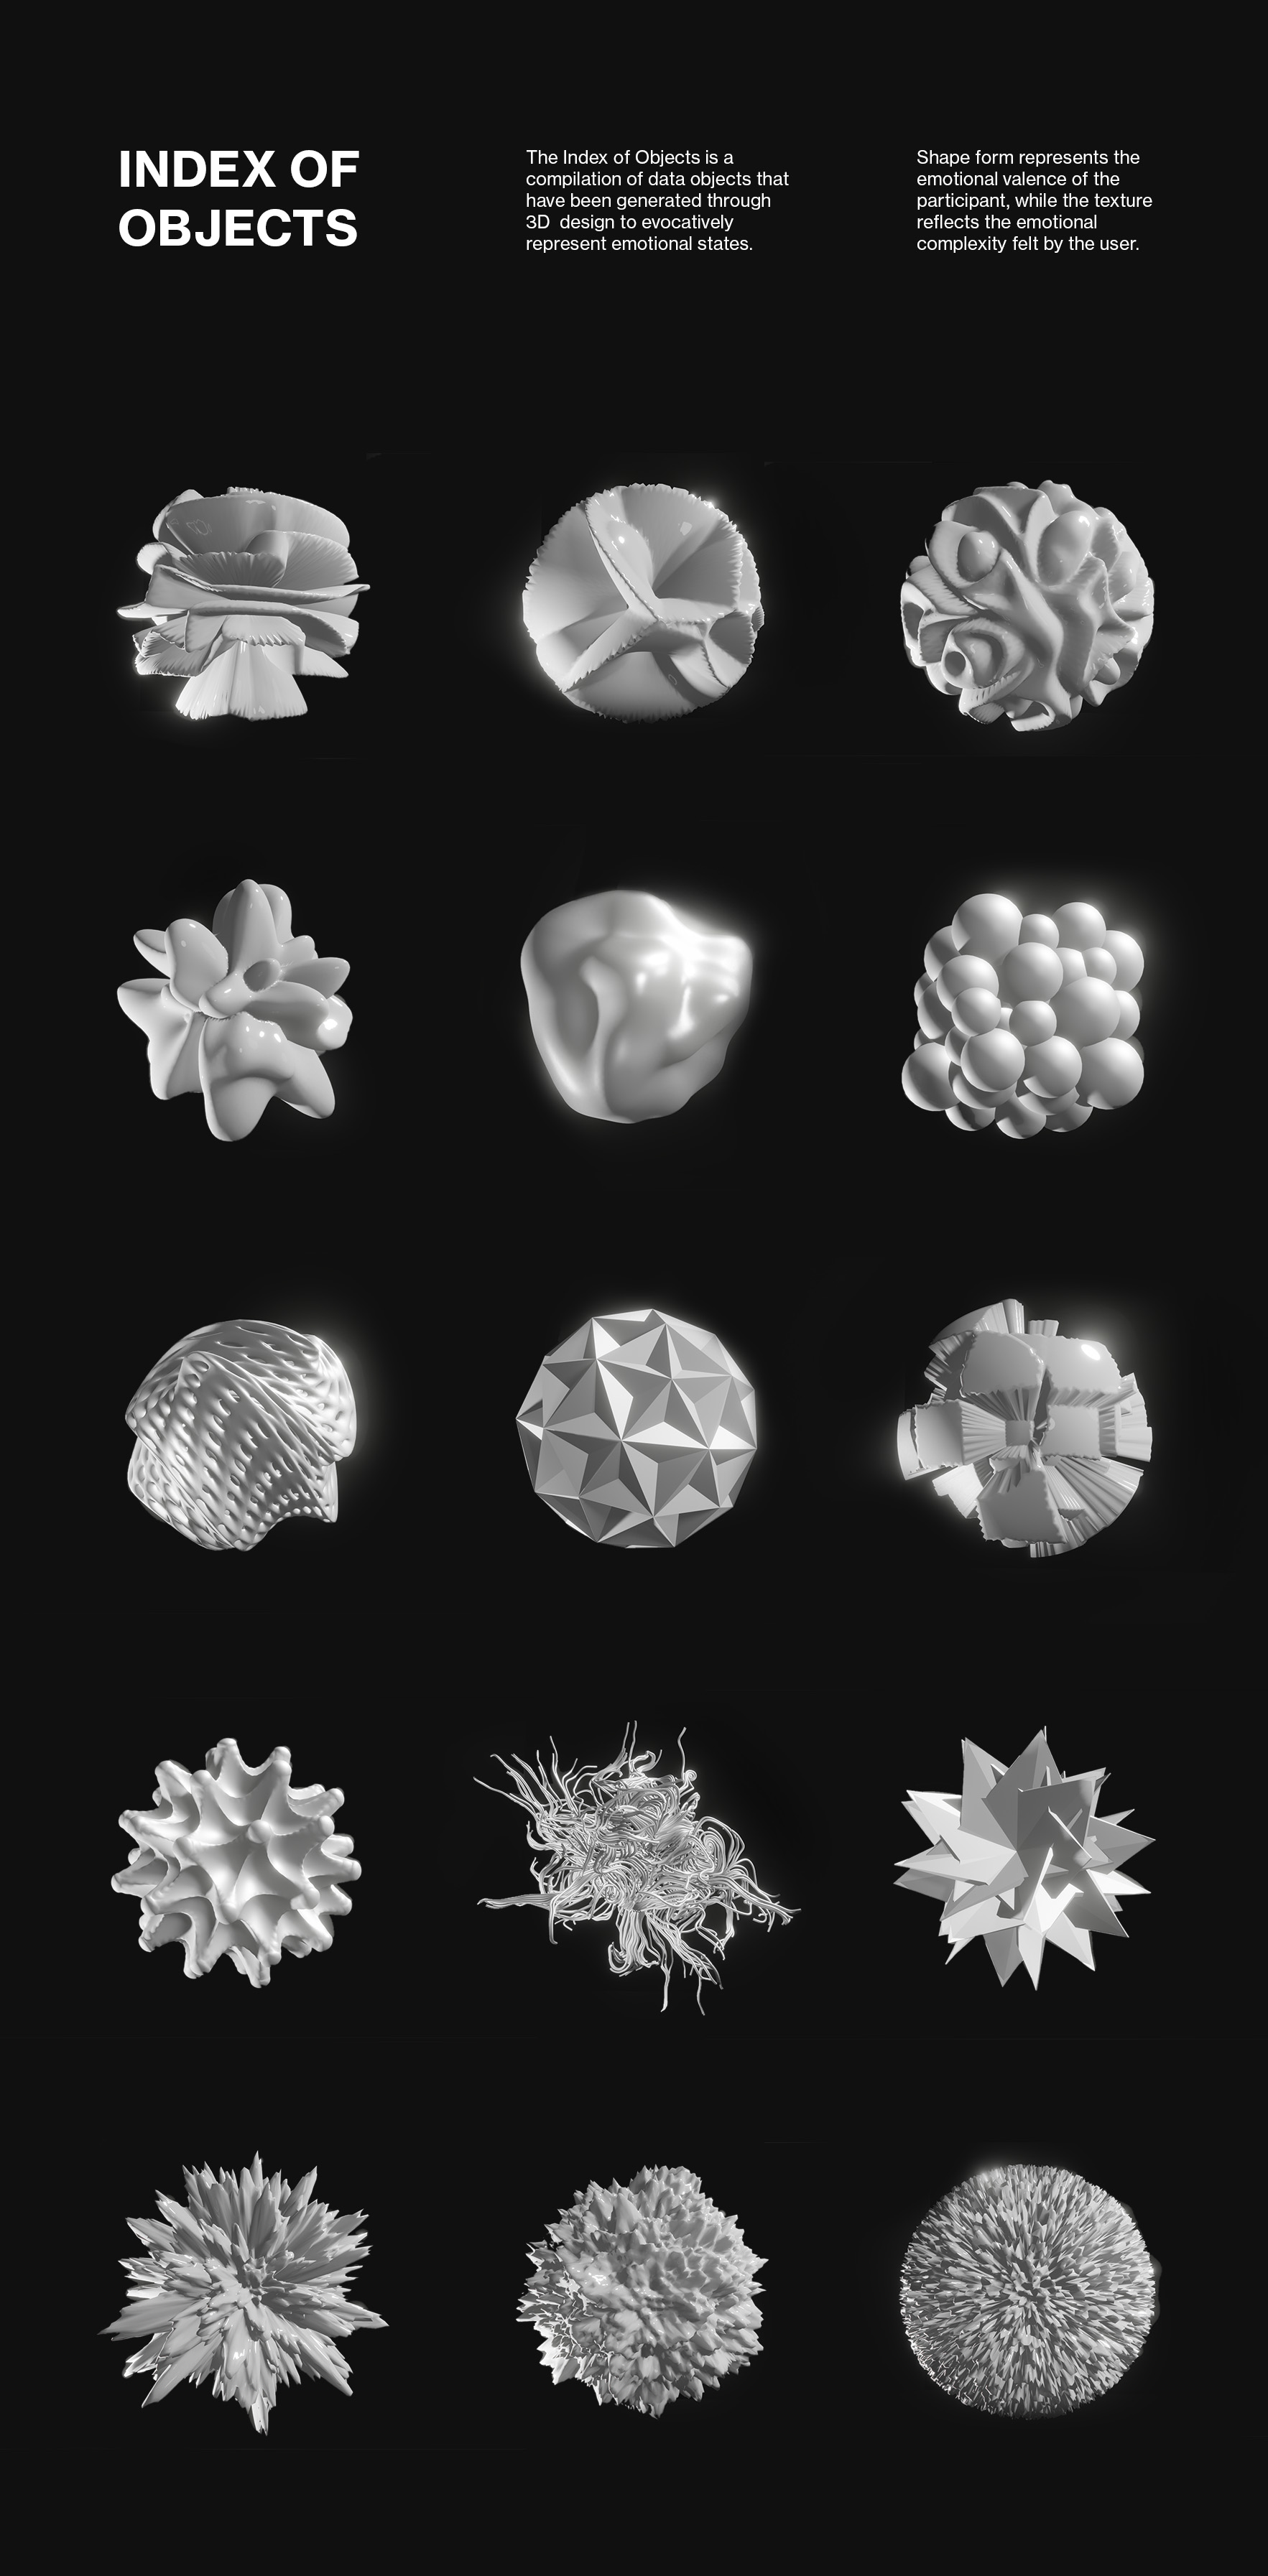

Index of Objects is a comparative documentation of the various data objects. This section serves to compile the data objects as a way to systematically, catalogue, analyse and document the process and concepts of each data object.
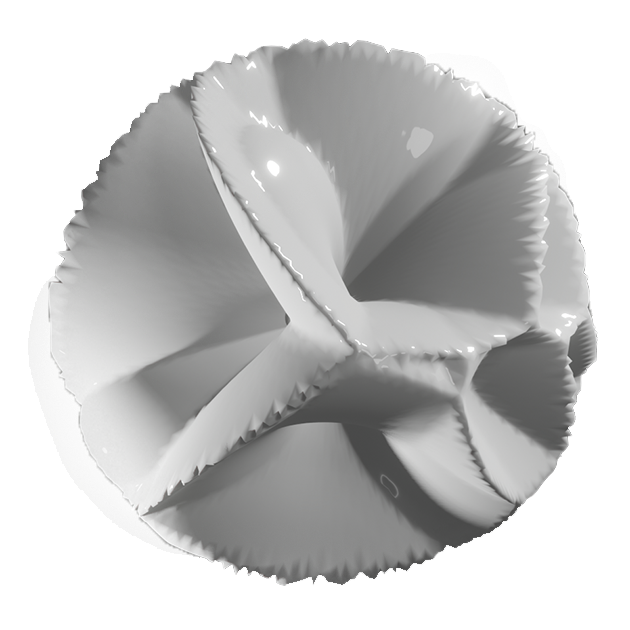
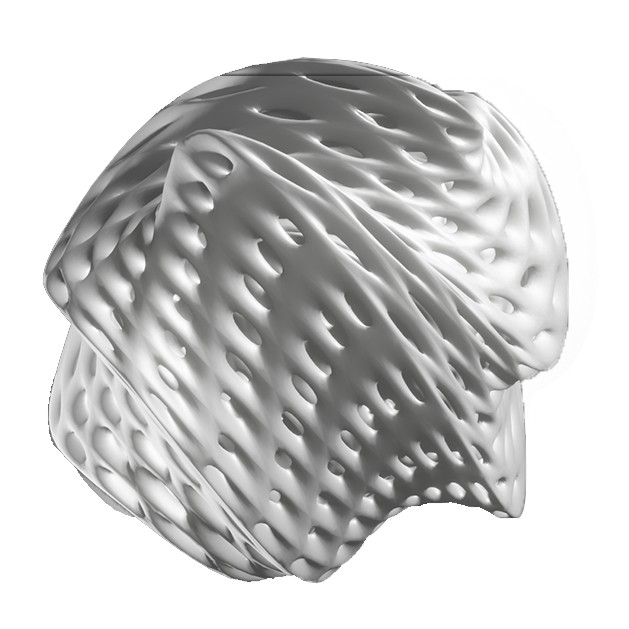
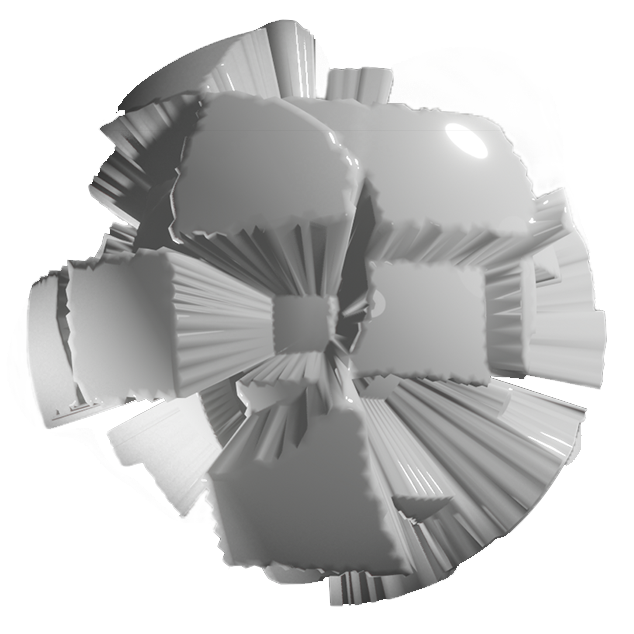
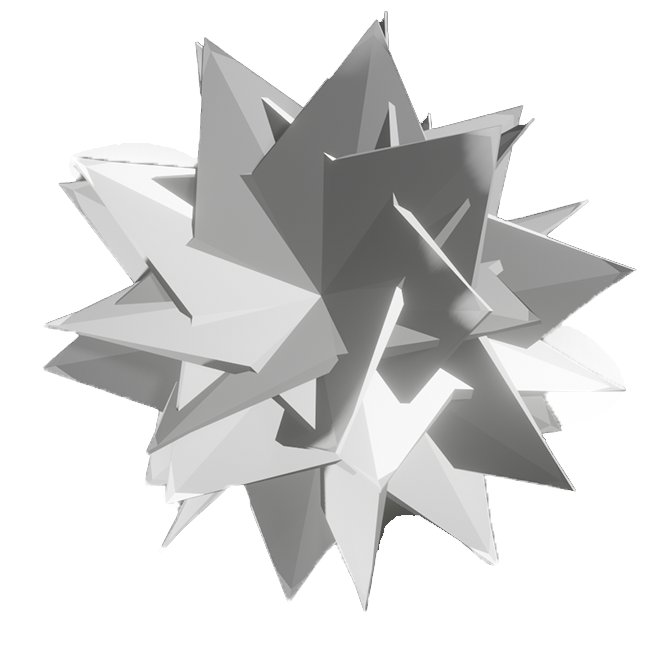
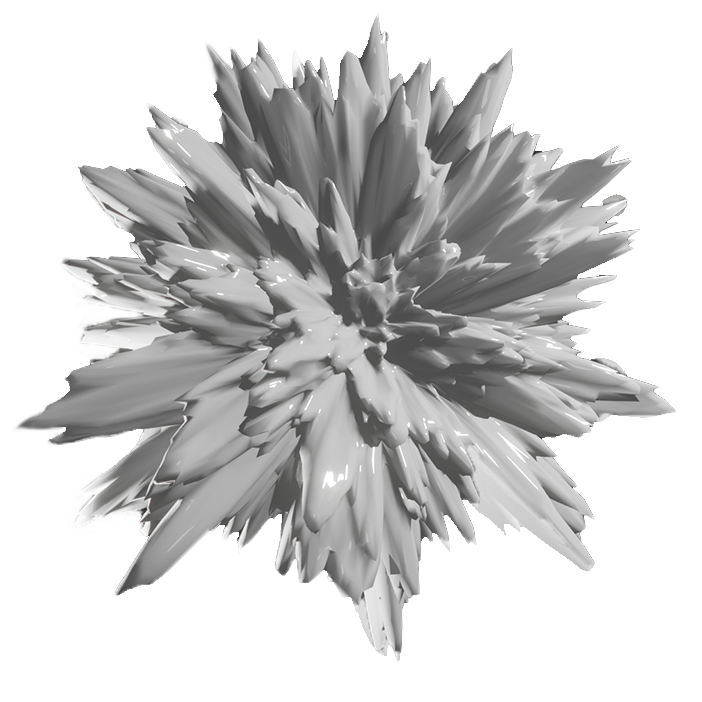
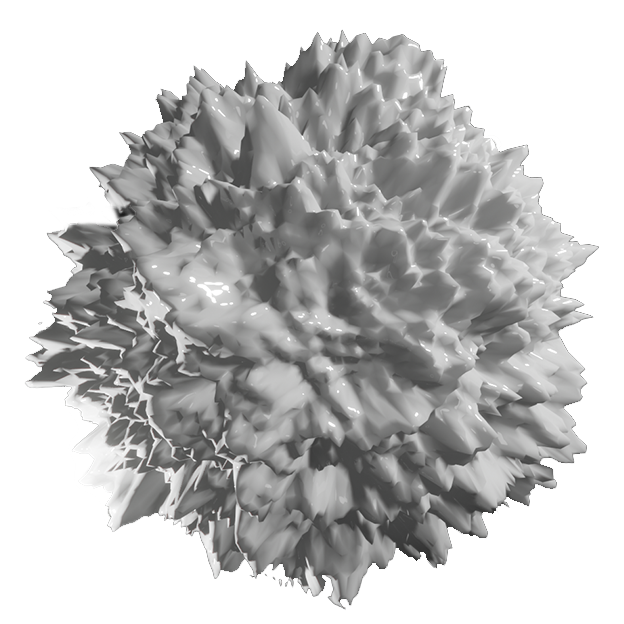
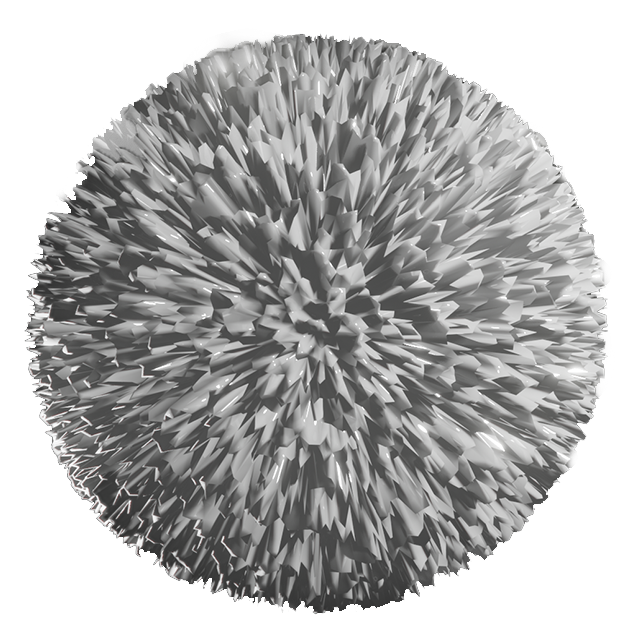
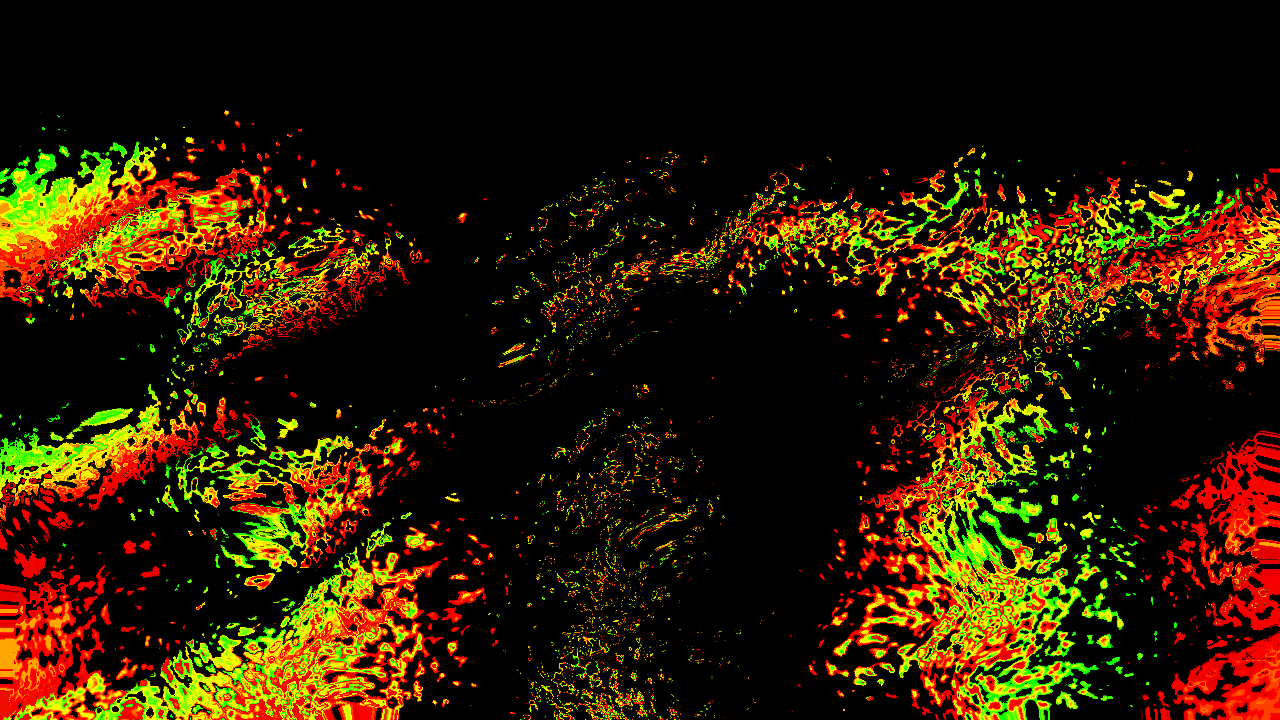
The form represents the emotional valence of
the participant, while the texture reflects the emotional complexity felt by the participant. Emotional valence refers to the positive or negative emotional state felt by the user, while emotional complexity refers to the emotional stability spectrum of the user.
Emotional valence can be portrayed through visual or sensory implementations that connote positive or negative meanings. For instance, a rounded object is compared to a spikey object. Emotional complexity, as per its name, is reflected through how complex, detail or intricate the design of the data objects is. A rough texture can be interpreted as a more chaotic emotional state as compared to a smooth texture. Emotional valence can be interpreted from the texture in some cases. A bumpy texture can suggest a positive emotional valence as the overall shape form produced from the texture can appear bubbly or rounded which gives off a positive connotation. Likewise, a negative emotional valence can be represented through sharp edges which can produce a prickly sensation to symbolise negativity.


EXPERIENCE
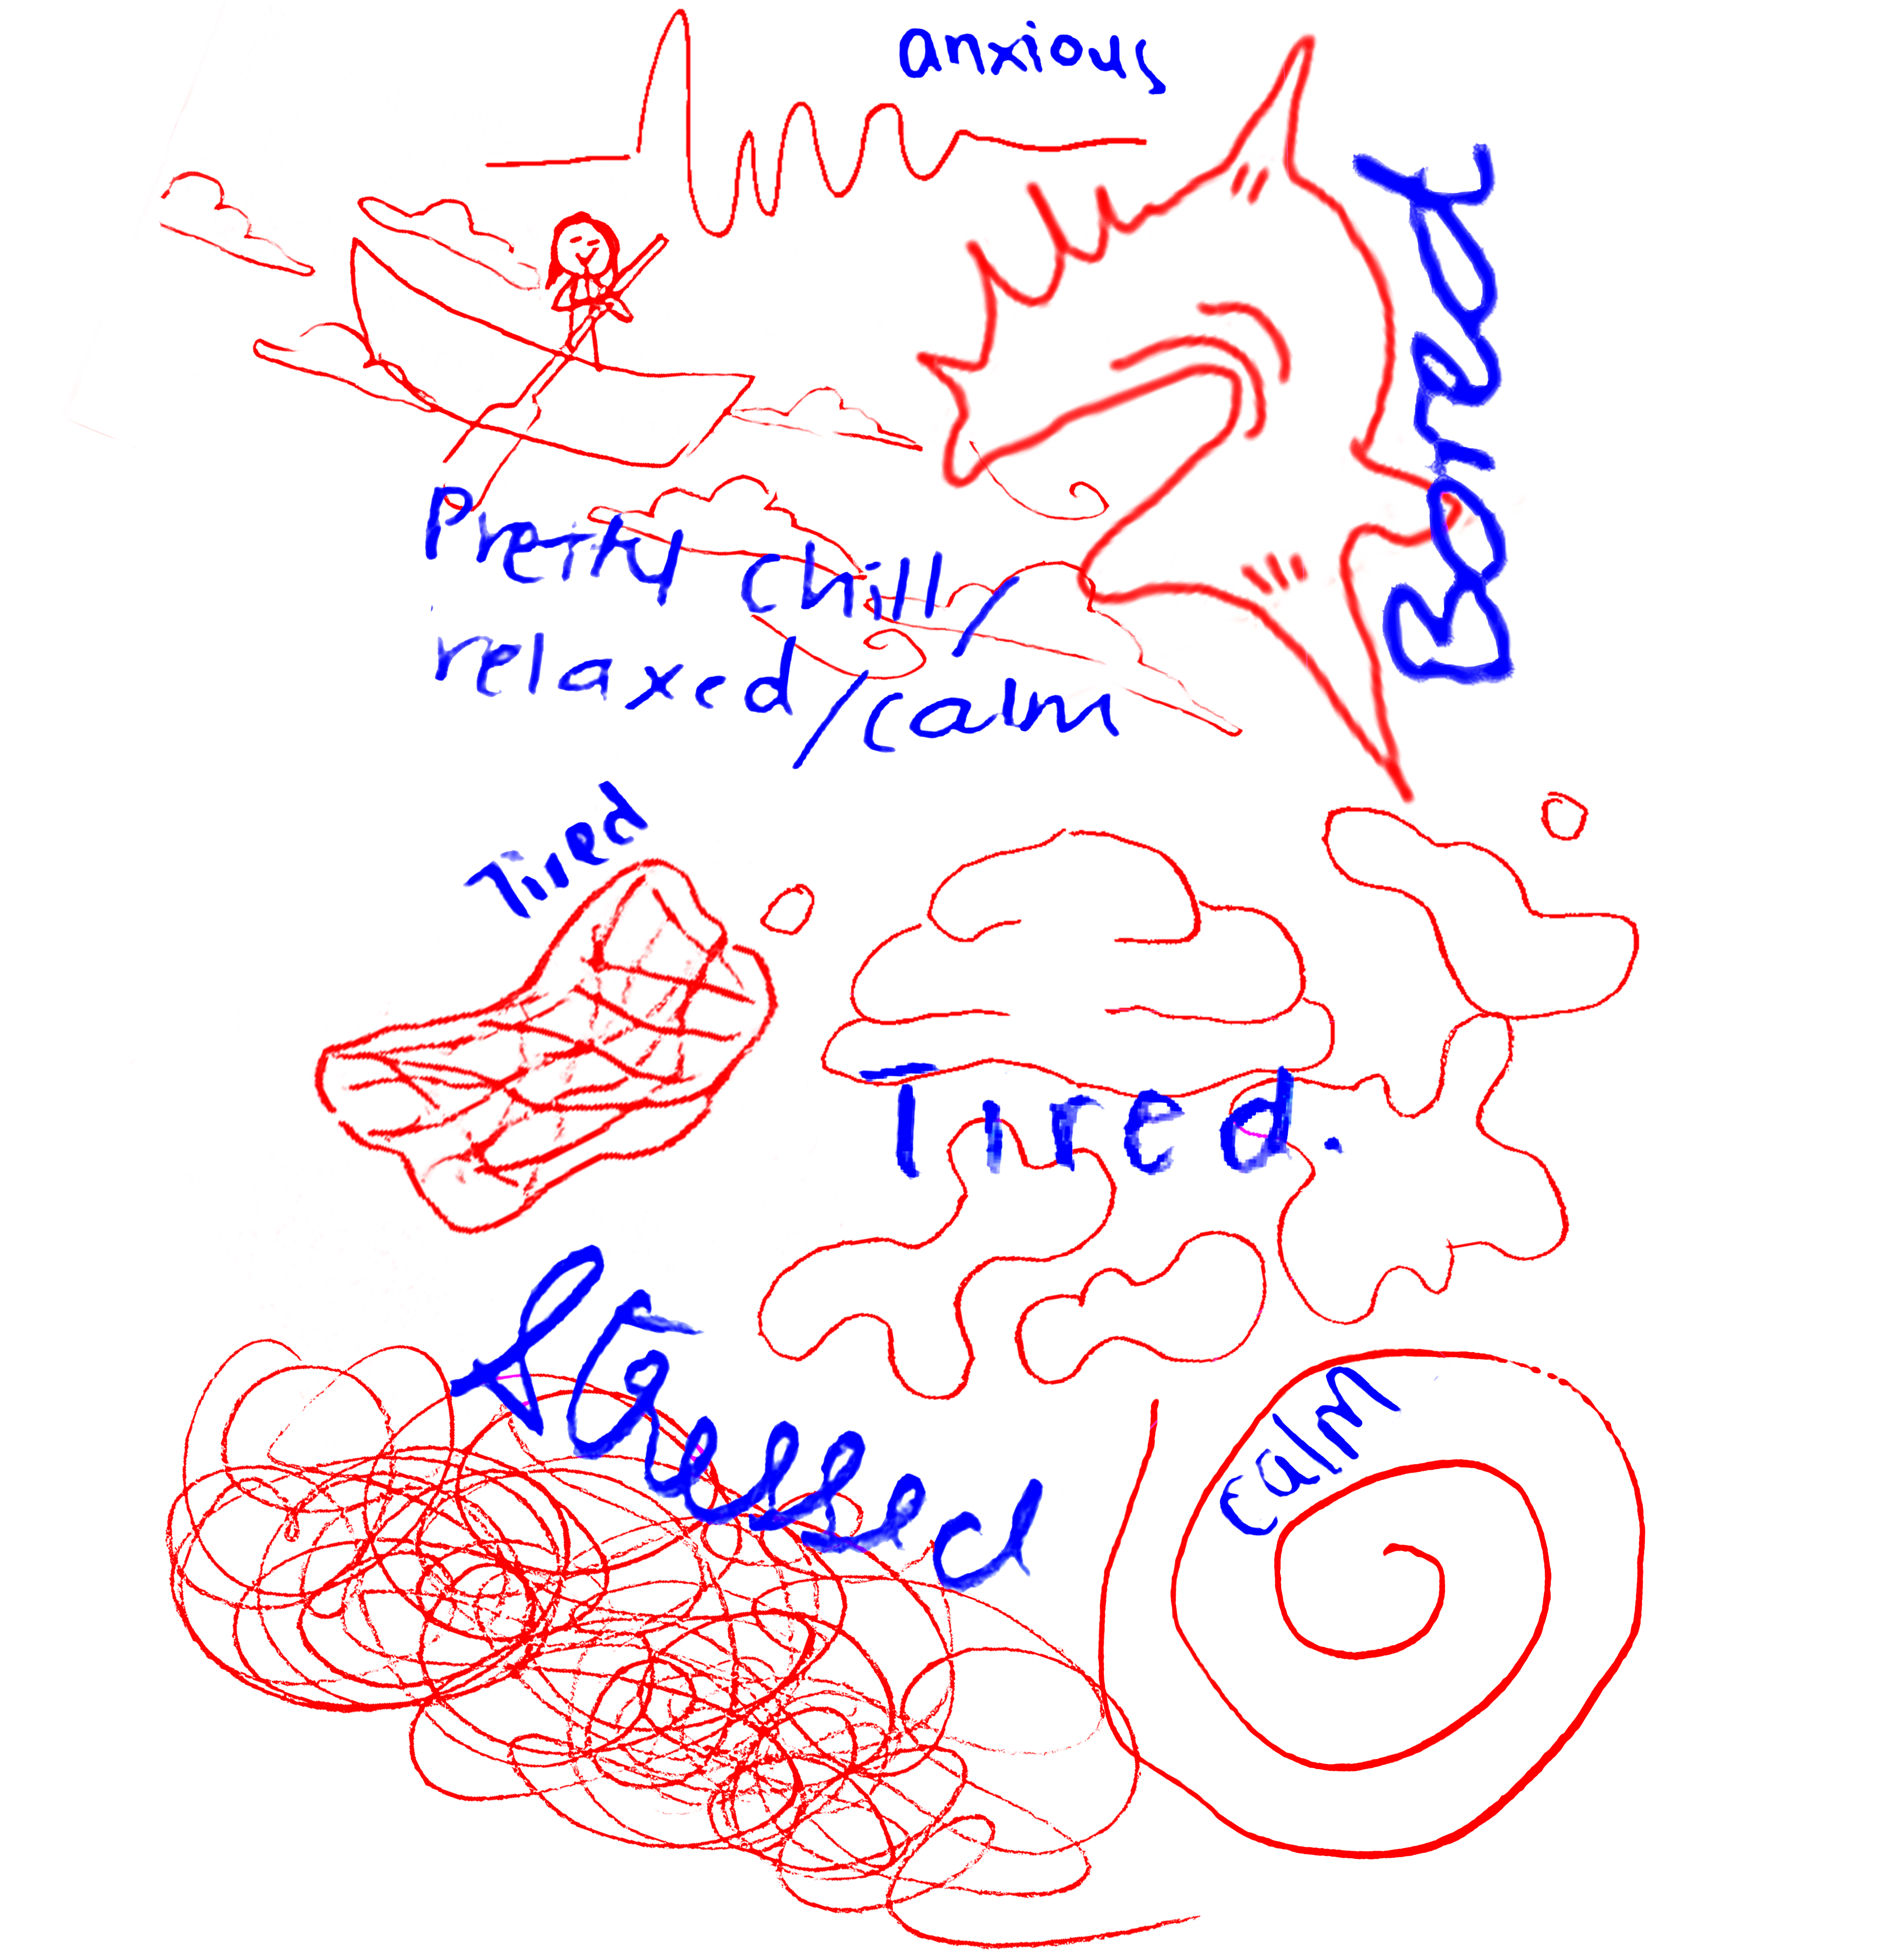
First, participants are led through a Digital Natives Assessment survey prior to the user-testing to jot down their current perception of emotional states and their idea of digital identities
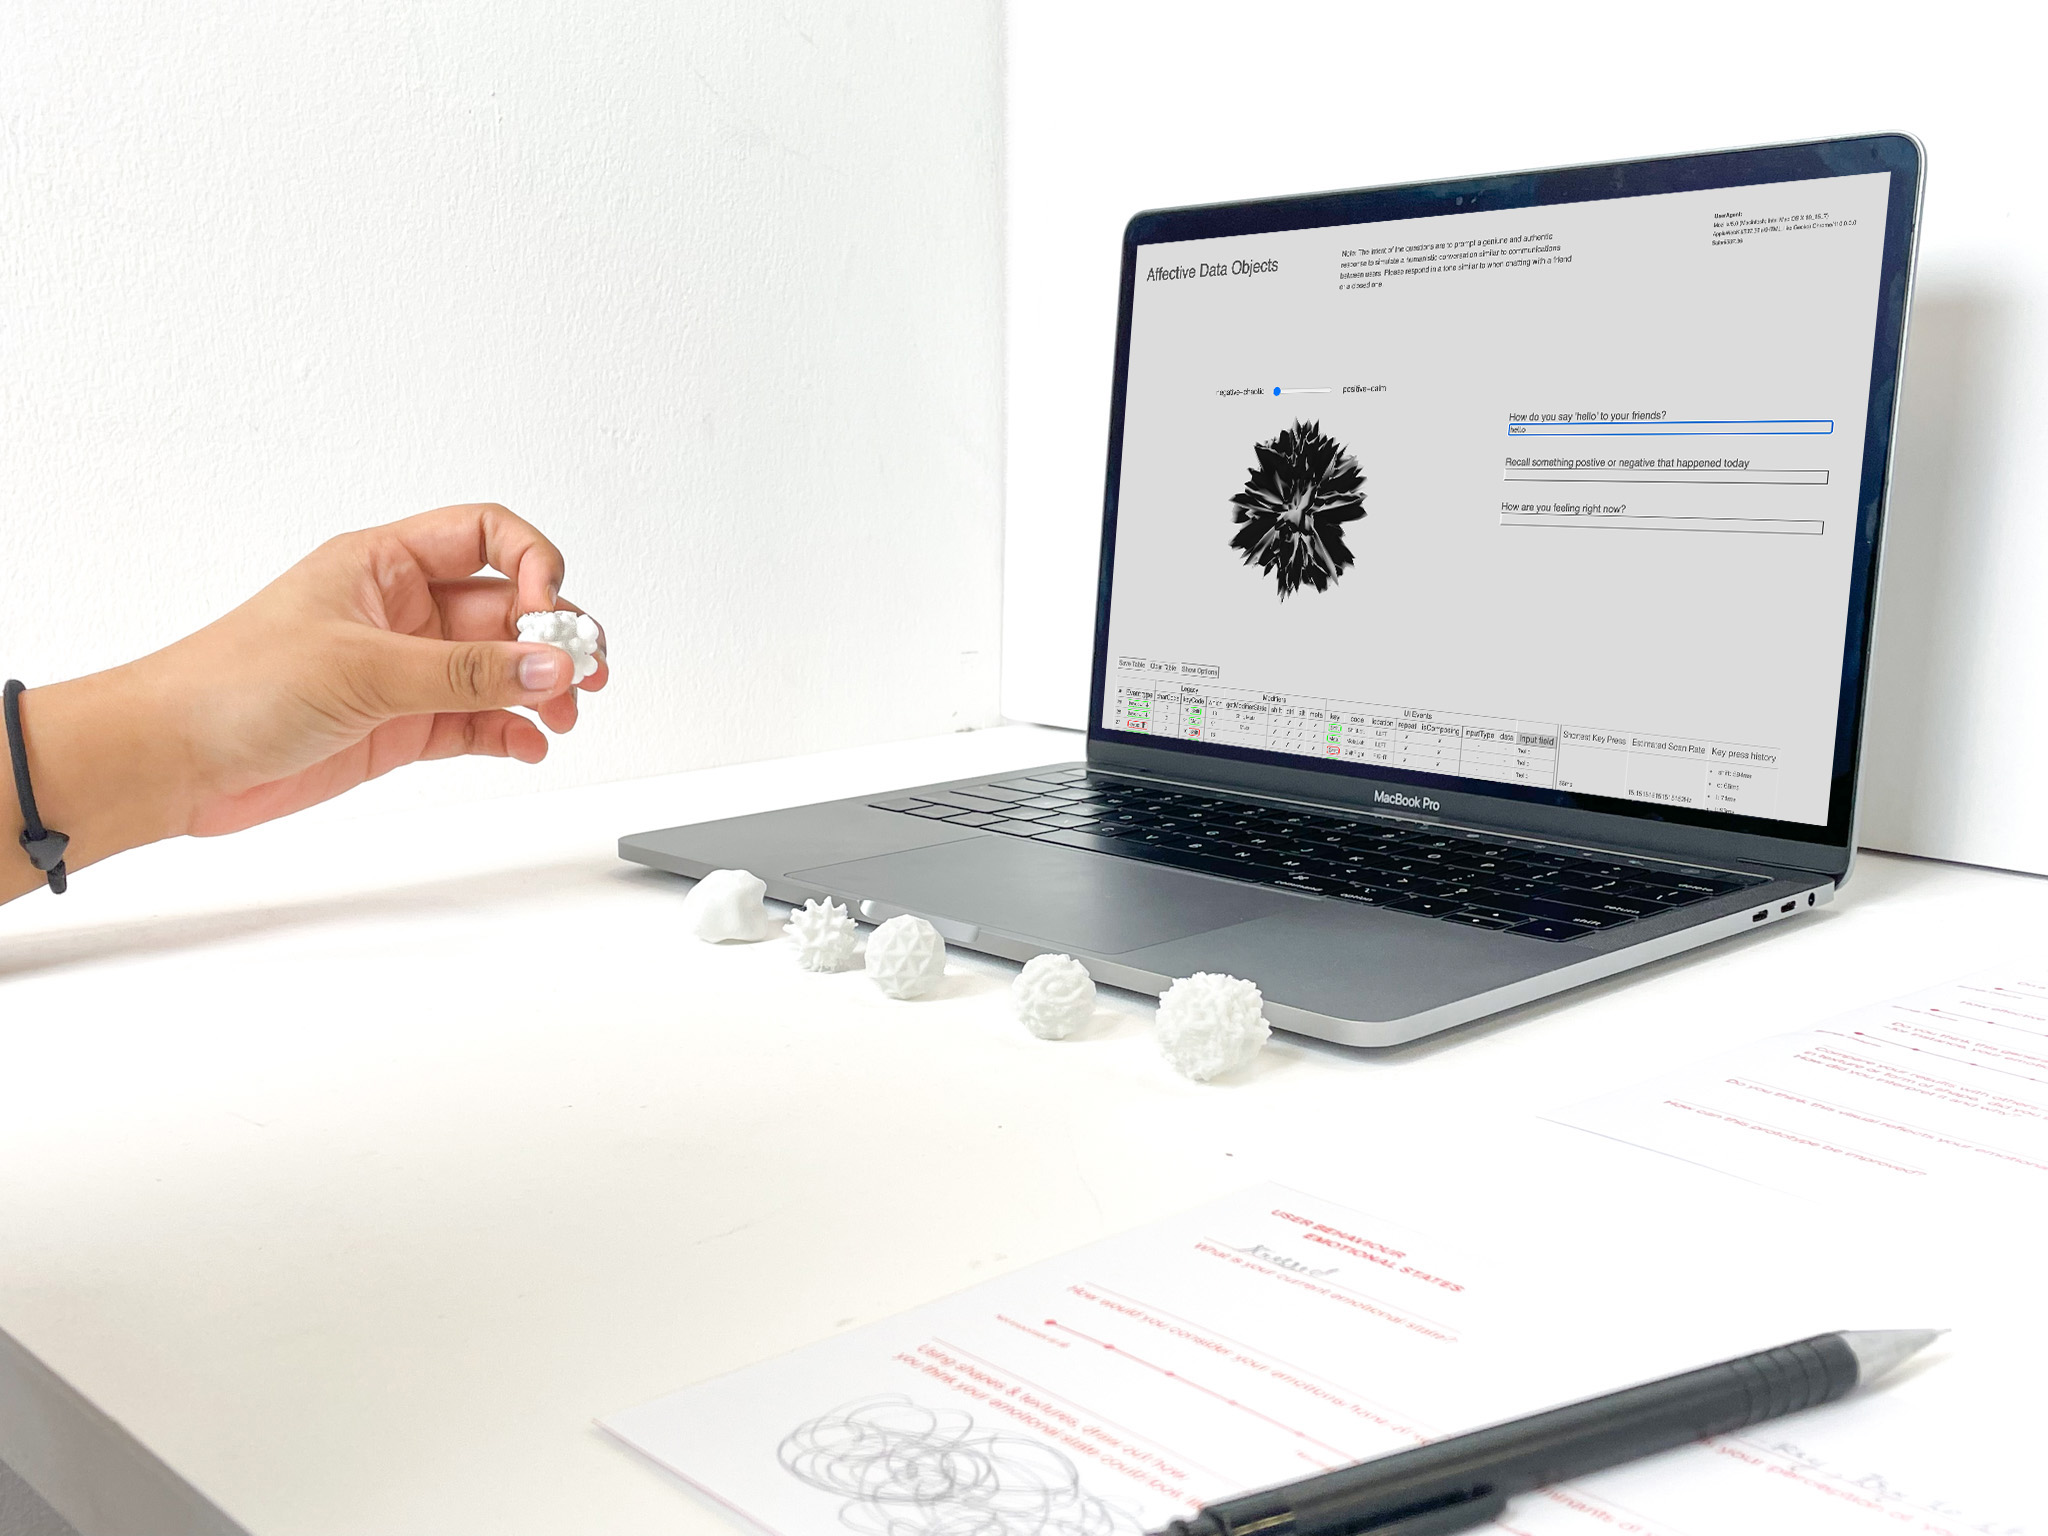
Second, participants are prompted to respond to a series of questions as a simulation for the keystroke data collection and analysis. Simultaneously, an affective data object reflecting the user's emotional state will be generated based on the analysis of their keystroke patterns.
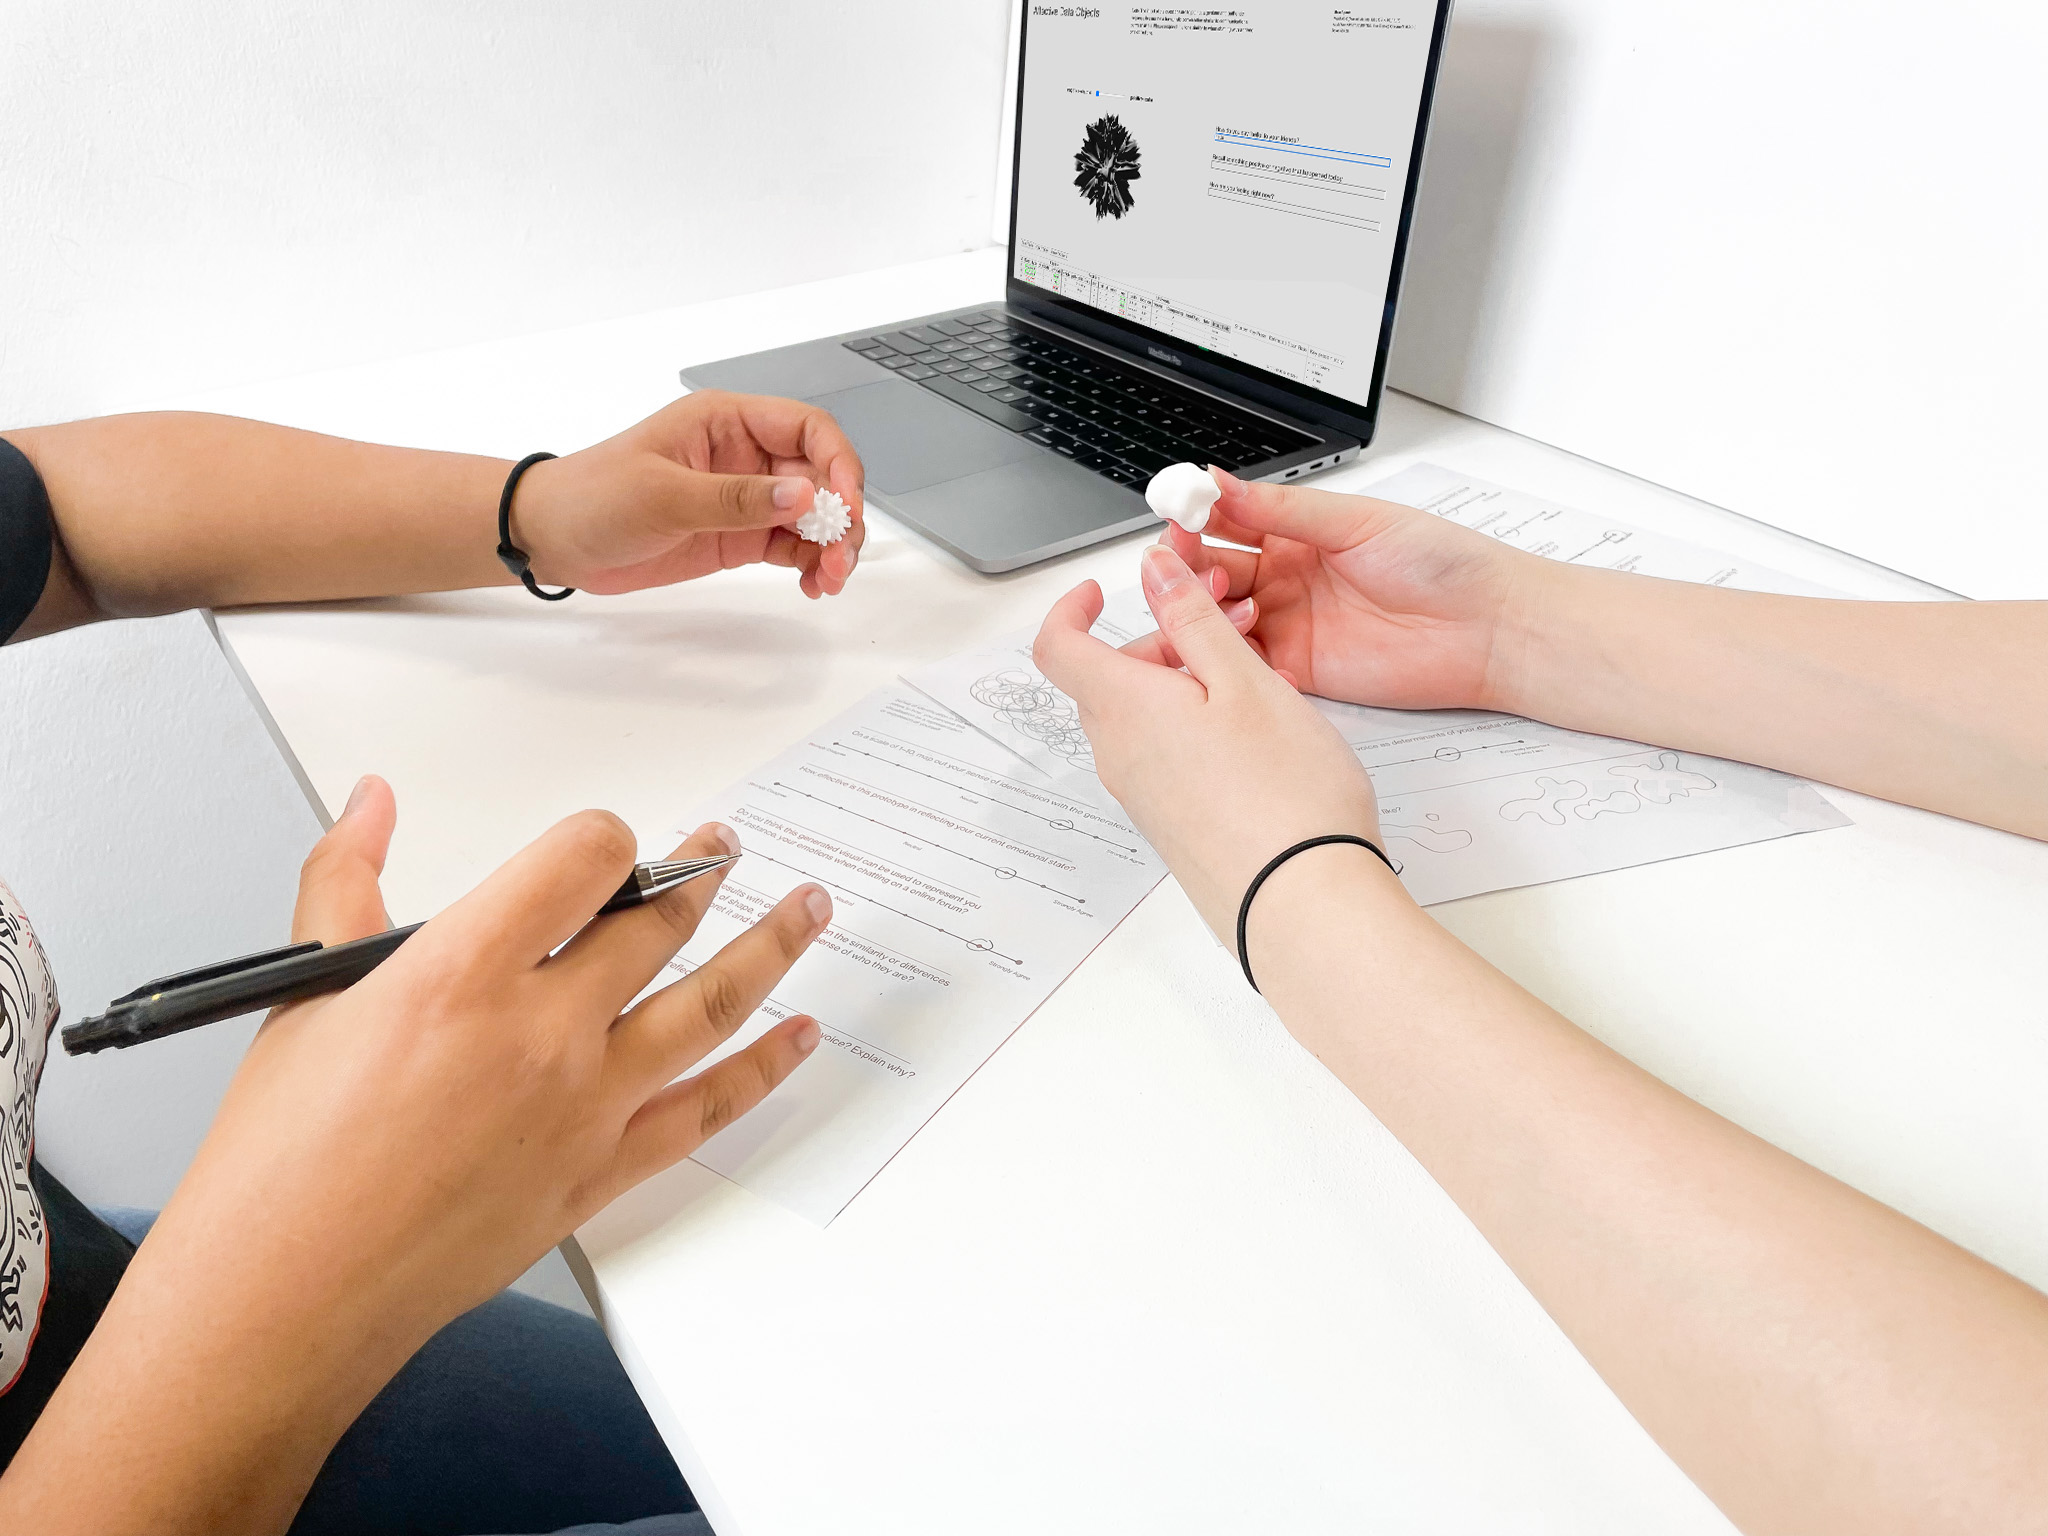
Third, participants can interact with the physical affective data object to feel the texture and form of the shape, allowing them to better interpret the complexity of the object through their sense of touch. Sensory interaction also allows participants to self-evaluate their sense of identification with the data object following the visual and tactile experiences.

Conversations between participants showed that identities could be recognised and perceived by others through the use of affective data objects as identity representation tools. User testing results evaluated through the SIPI scale revealed that users have a high sense of identification with the affective data objects due to their interpretation of the texture, complexity and shape of the object
USER-TEST
The SIPI scale carried out after the prototype usability test recorded a mean score of 86.9% in terms of the data object’s ability to identify, represent and communicate with participants (refer to Appendix C). Out of these three evaluating factors, Affective Data Objects performed best in its ability to communicate in a social setting, achieving a 93.3% rating which indicates that participants could recognise and relate to each other through their representative data objects (refer to Appendix C).
Interestingly, similar observations were found between the preliminary documentation of the participant’s self-illustrated emotional state and the data object generated from the prototype. Results from both visuals exude similar shape, form and complexity, which implies an accurate depiction of the data object to the current emotional state of participants. Insightful findings were also derived when a few participants went beyond the visual denotation of shapeforms, instead, they interpreted the data objects based on their sensations–one noted that “the smooth bumps feel calming to touch” (refer to Appendix B) which resulted in them associating it with positive emotions, while another said that the “prickly sensation from the spikes” invoked a negative emotion (refer to Appendix B).
→ Appendix B
→ Appendix C
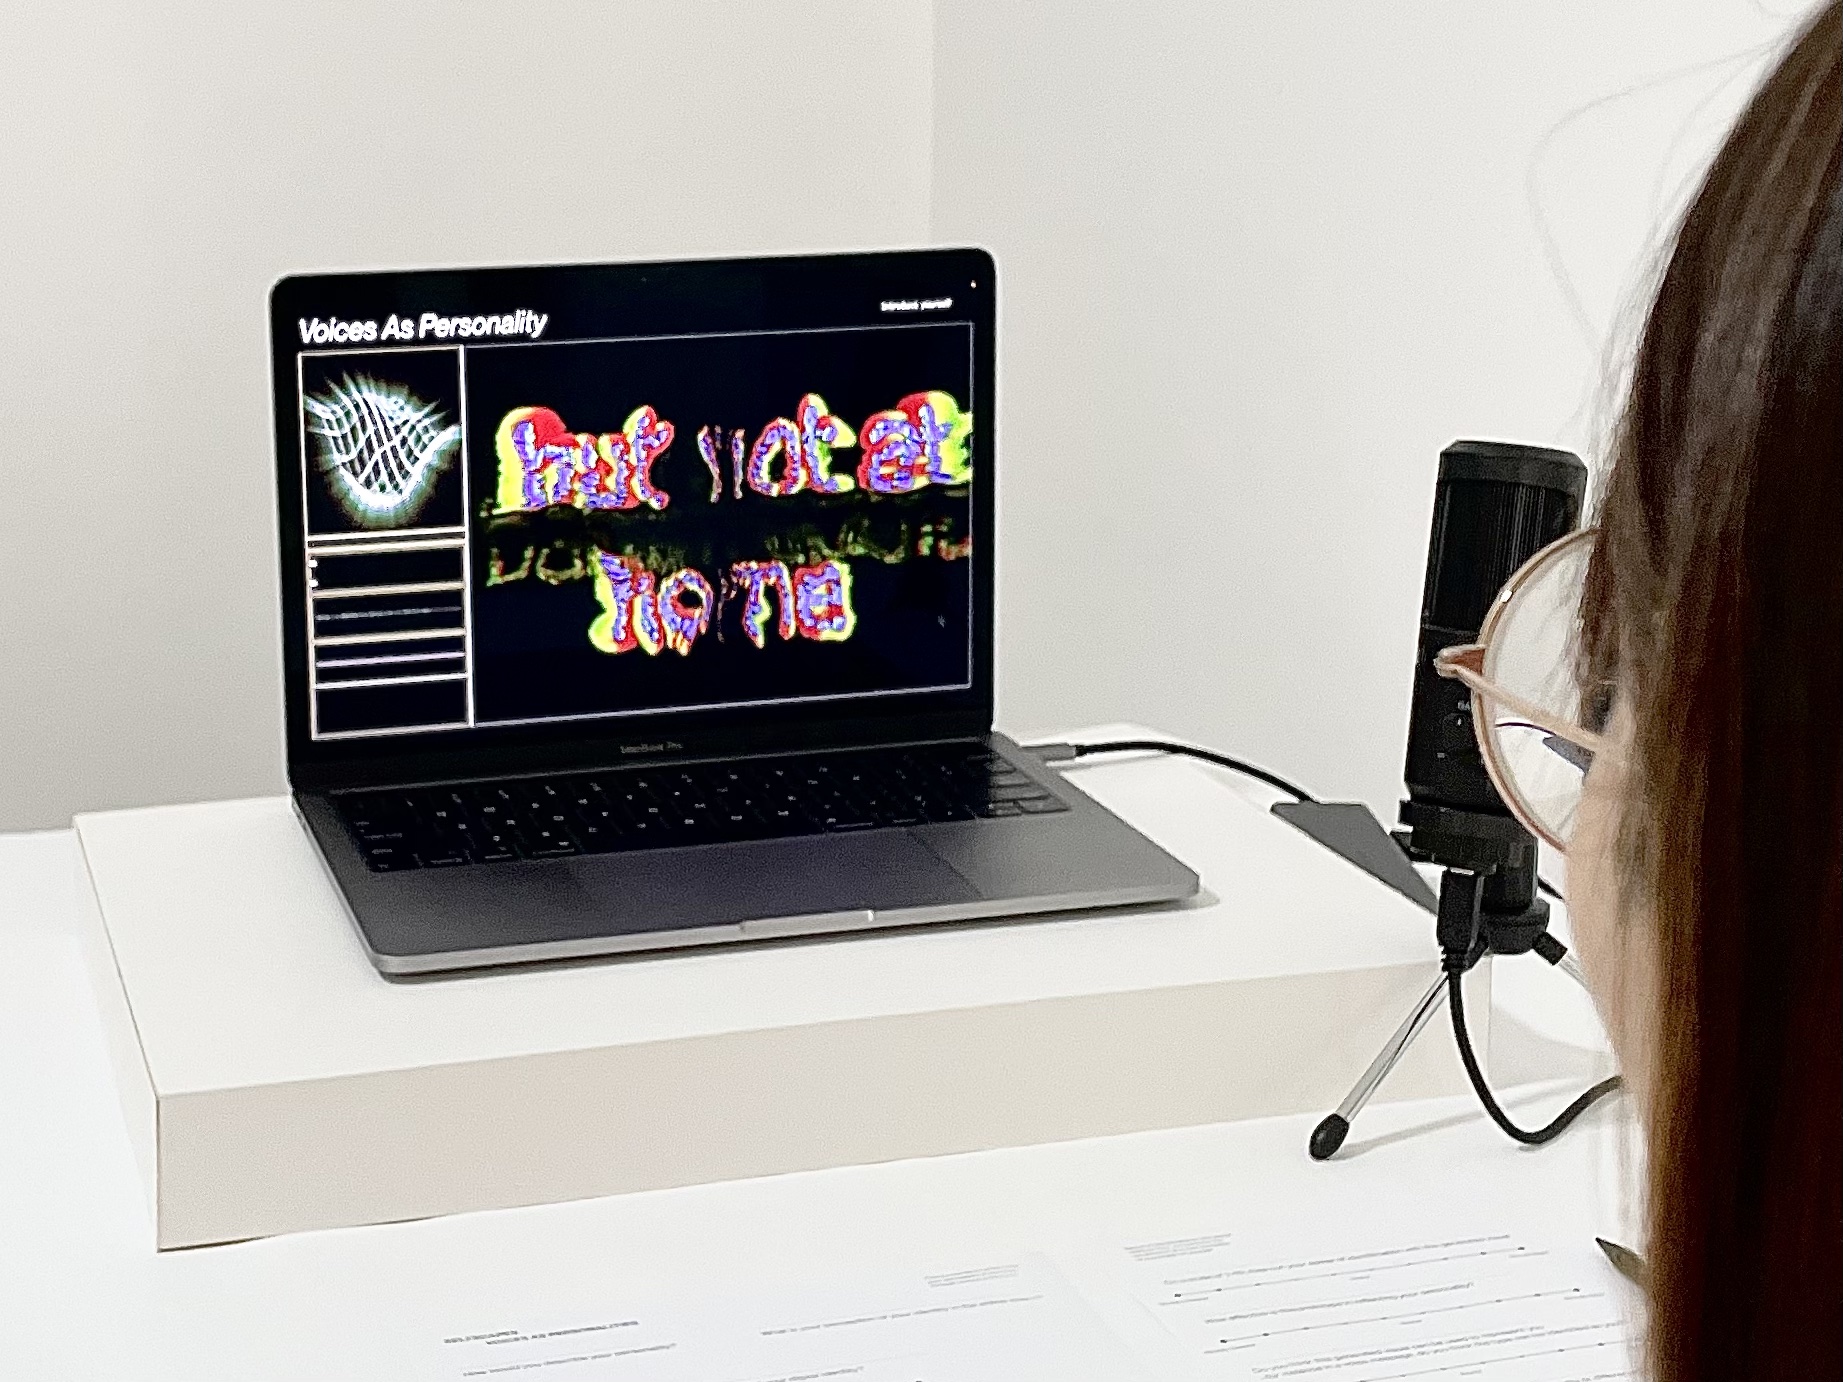
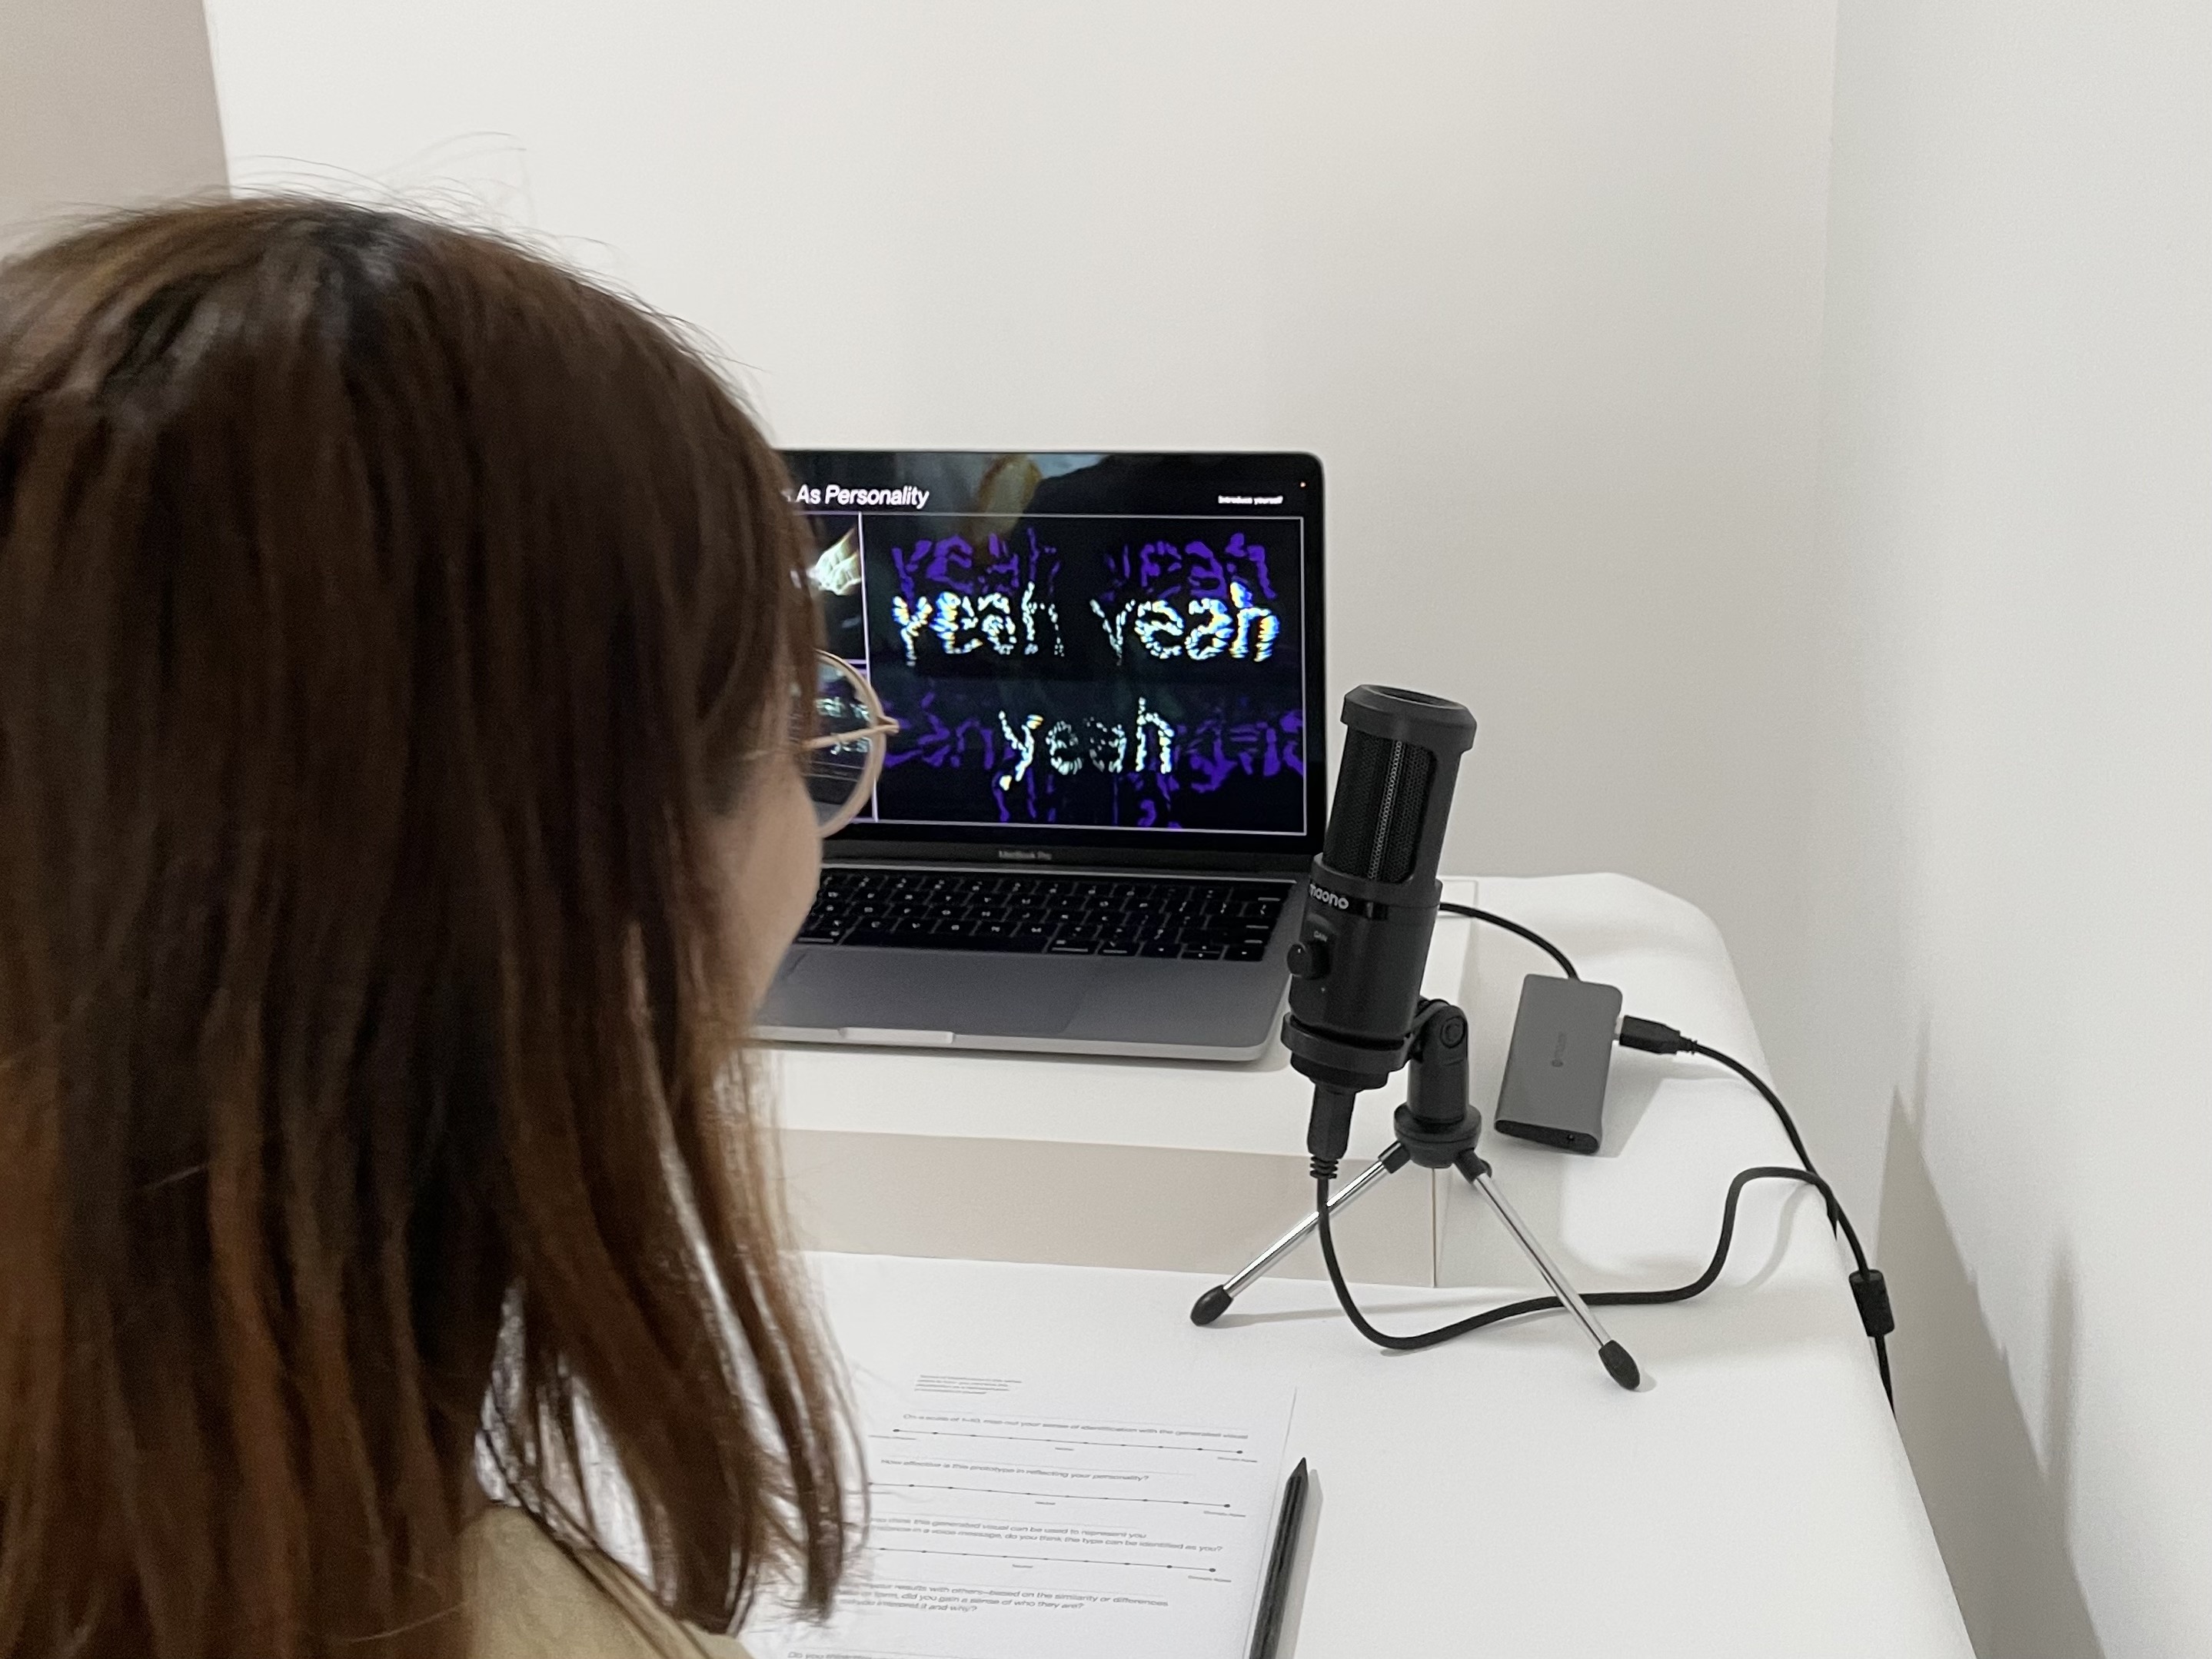
VOICES AS
PERSONALITY
VOICES AS
PERSONALITY
The second prototype looks into the scientific analysis of vocal traits in relation to user personalities.
Voices as Personality explores the concept of identity based on the qualities and traits of one’s personality. Personality spectrums such as extroversion, openness and neuroticism are visualised to represent a digital identity.
Allport, Gordon, and Cantril, Hadley. “Judging personality from voice”.
The Journal of Social
Psychology, vol. 5, no. 1, Taylor & Francis, 1934, pp. 37-55.
Belin, Pascal, et al. The sound of trustworthiness: Acoustic-based modulation of perceived voice personality.
PLoS ONE, 2017, pp. 1-9.
From a naturalist perspective, identity is often associated with one’s physical appearance. Aspects of identity such as appearances and behaviour can be easily replicated and visualised, whereas speech is a non-tangible element that cannot be ‘seen’ in the digital space. Hence voices are often absent or deemed insubstantial in the composition of identifiers.
Contrary to that belief, voices have been known to be a powerful medium for understanding more about the mind and body. Through voices, information about one’s physiology, demographics, health and cultural background can be extracted (Allport & Cantril 37). Therefore, first impressions are often made when we associate the voice we hear with an inferred persona of the individual. Where physical appearance serves as a visual representation of identities, similarly voices function as an audiovisual cue for one’s identity (Belin et al. 2).
Multiple research observing the relationship between linguistic and personality attributes have also commonly reported that vocal traits can be a key determinant of one’s personality. Hence, this prototype utilises computation in the statistical analysis of voice samples to deduce vocal characteristics as a basis for perceived voice personality. Through this, voices are made visible to the human eyes, to fulfil the potential of voices in the representation of identities.
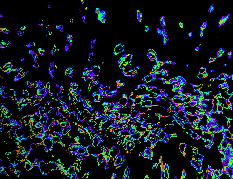
Vocal inputs are captured through a microphone and collated in a voice analysis deck. In the voice analysis deck, vocal inputs are transcribed into data values and then plotted onto graphs to display the visual progression of translating vocal data into typographic expressions. Acoustical measurements of the volume, pitch and frequency from graphs can aid in distinguishing vocal patterns from samples (Marrero et al. 1).
Marrero, Zachariah, et al. “Evaluating voice samples as a potential source of information about personality”. Acta Psychologica, vol. 230 Elsevier, 2022 pp. 1-10.
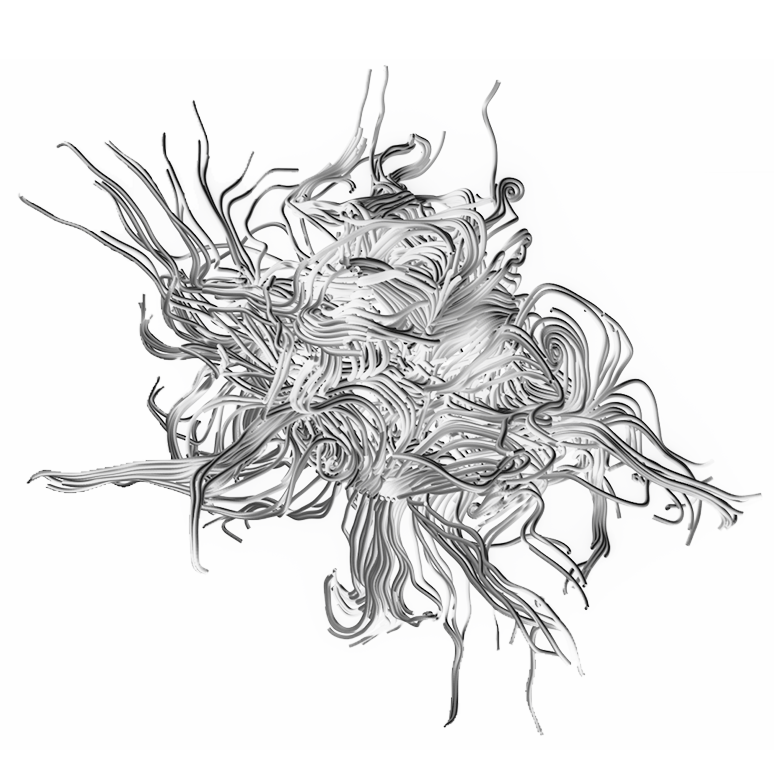
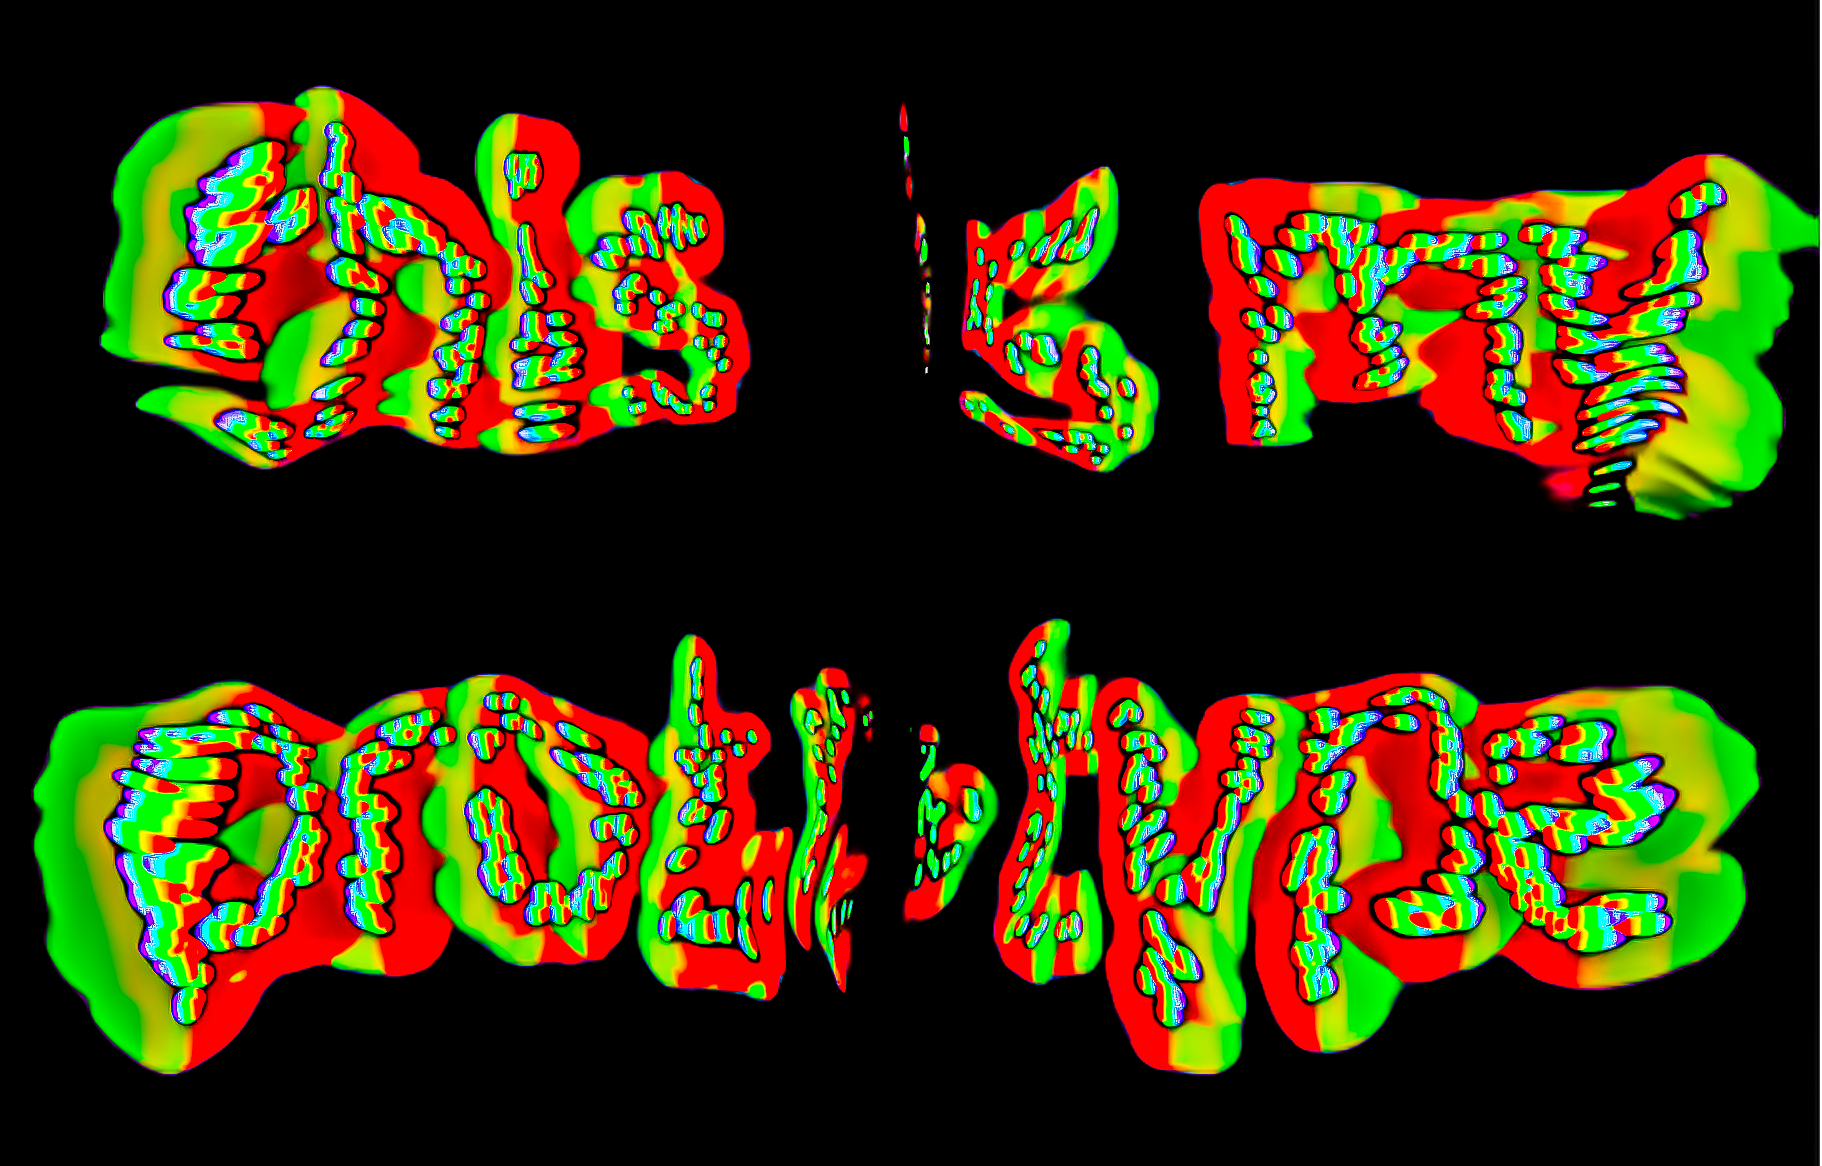
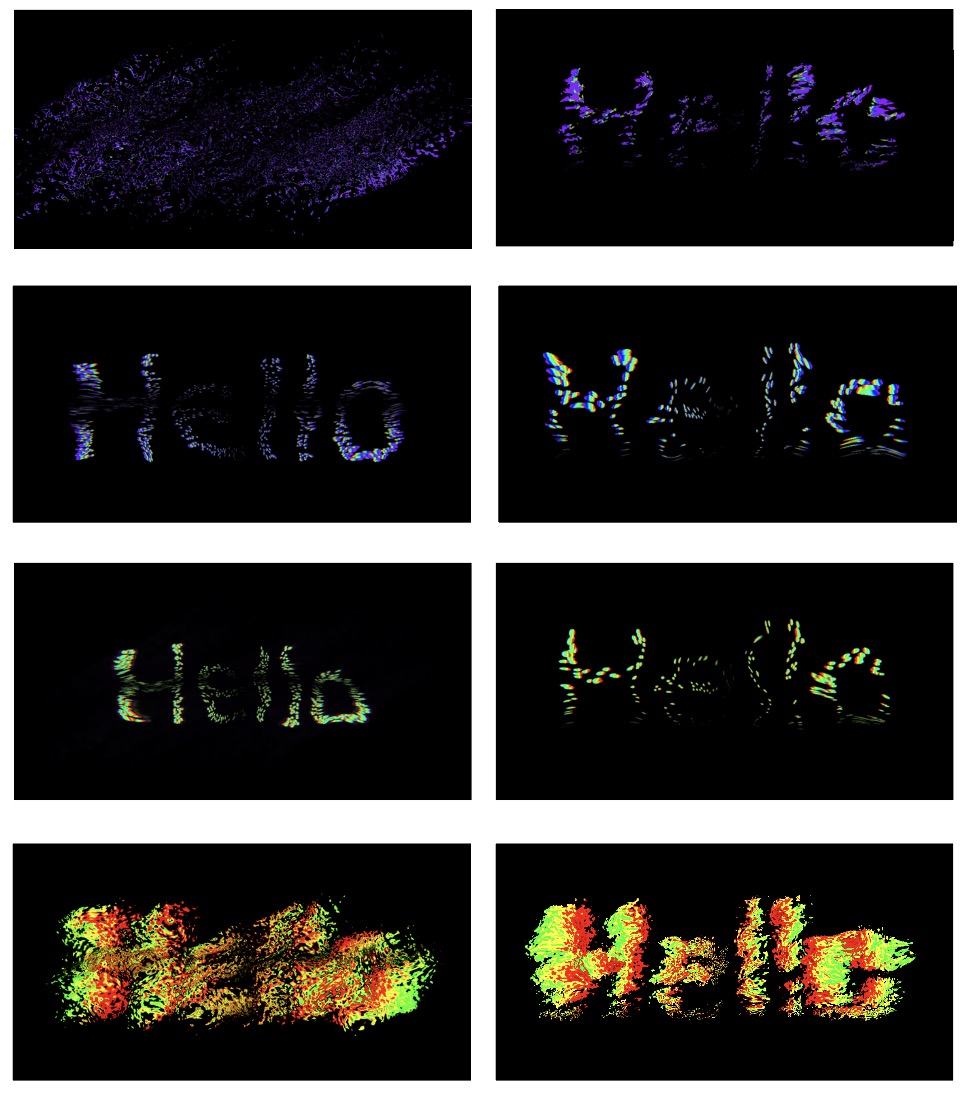
TYPOGRAPHIC EXPRESSION
The acoustical evaluation of linguistic traits poses as a verbal cue in manipulating the shape and movement of type to embody the intangibility of our voices. Each vocal quality is tied to a visual parameter within the letterform to draw connections between personality traits and typographic changes.
Taking on a progressive approach, the corresponding typographic distortions alongside the changes in vocal frequency creates a visual narrative that users are able to follow. The typographic evolution enables users to understand why certain changes in their voices affect the letterform, rather the evolving letterforms resemble something humanistic, enabling users to readily identify with the visualisation.
As compared to the systematic approaches in the third and fourth explorations, the progressive method creates a slightly higher level of identification with the user. Set together, the systematic method fails to nullify the ephemeral quality of voices as the switch between drastic typographic designs appeared random to users, making it difficult to identify with the typographic representation which resulted in a less impactful impression on the users. Whereas, the progressive method produced a lasting impression on its users which strengthens the degree of identification with the typographic outcome.
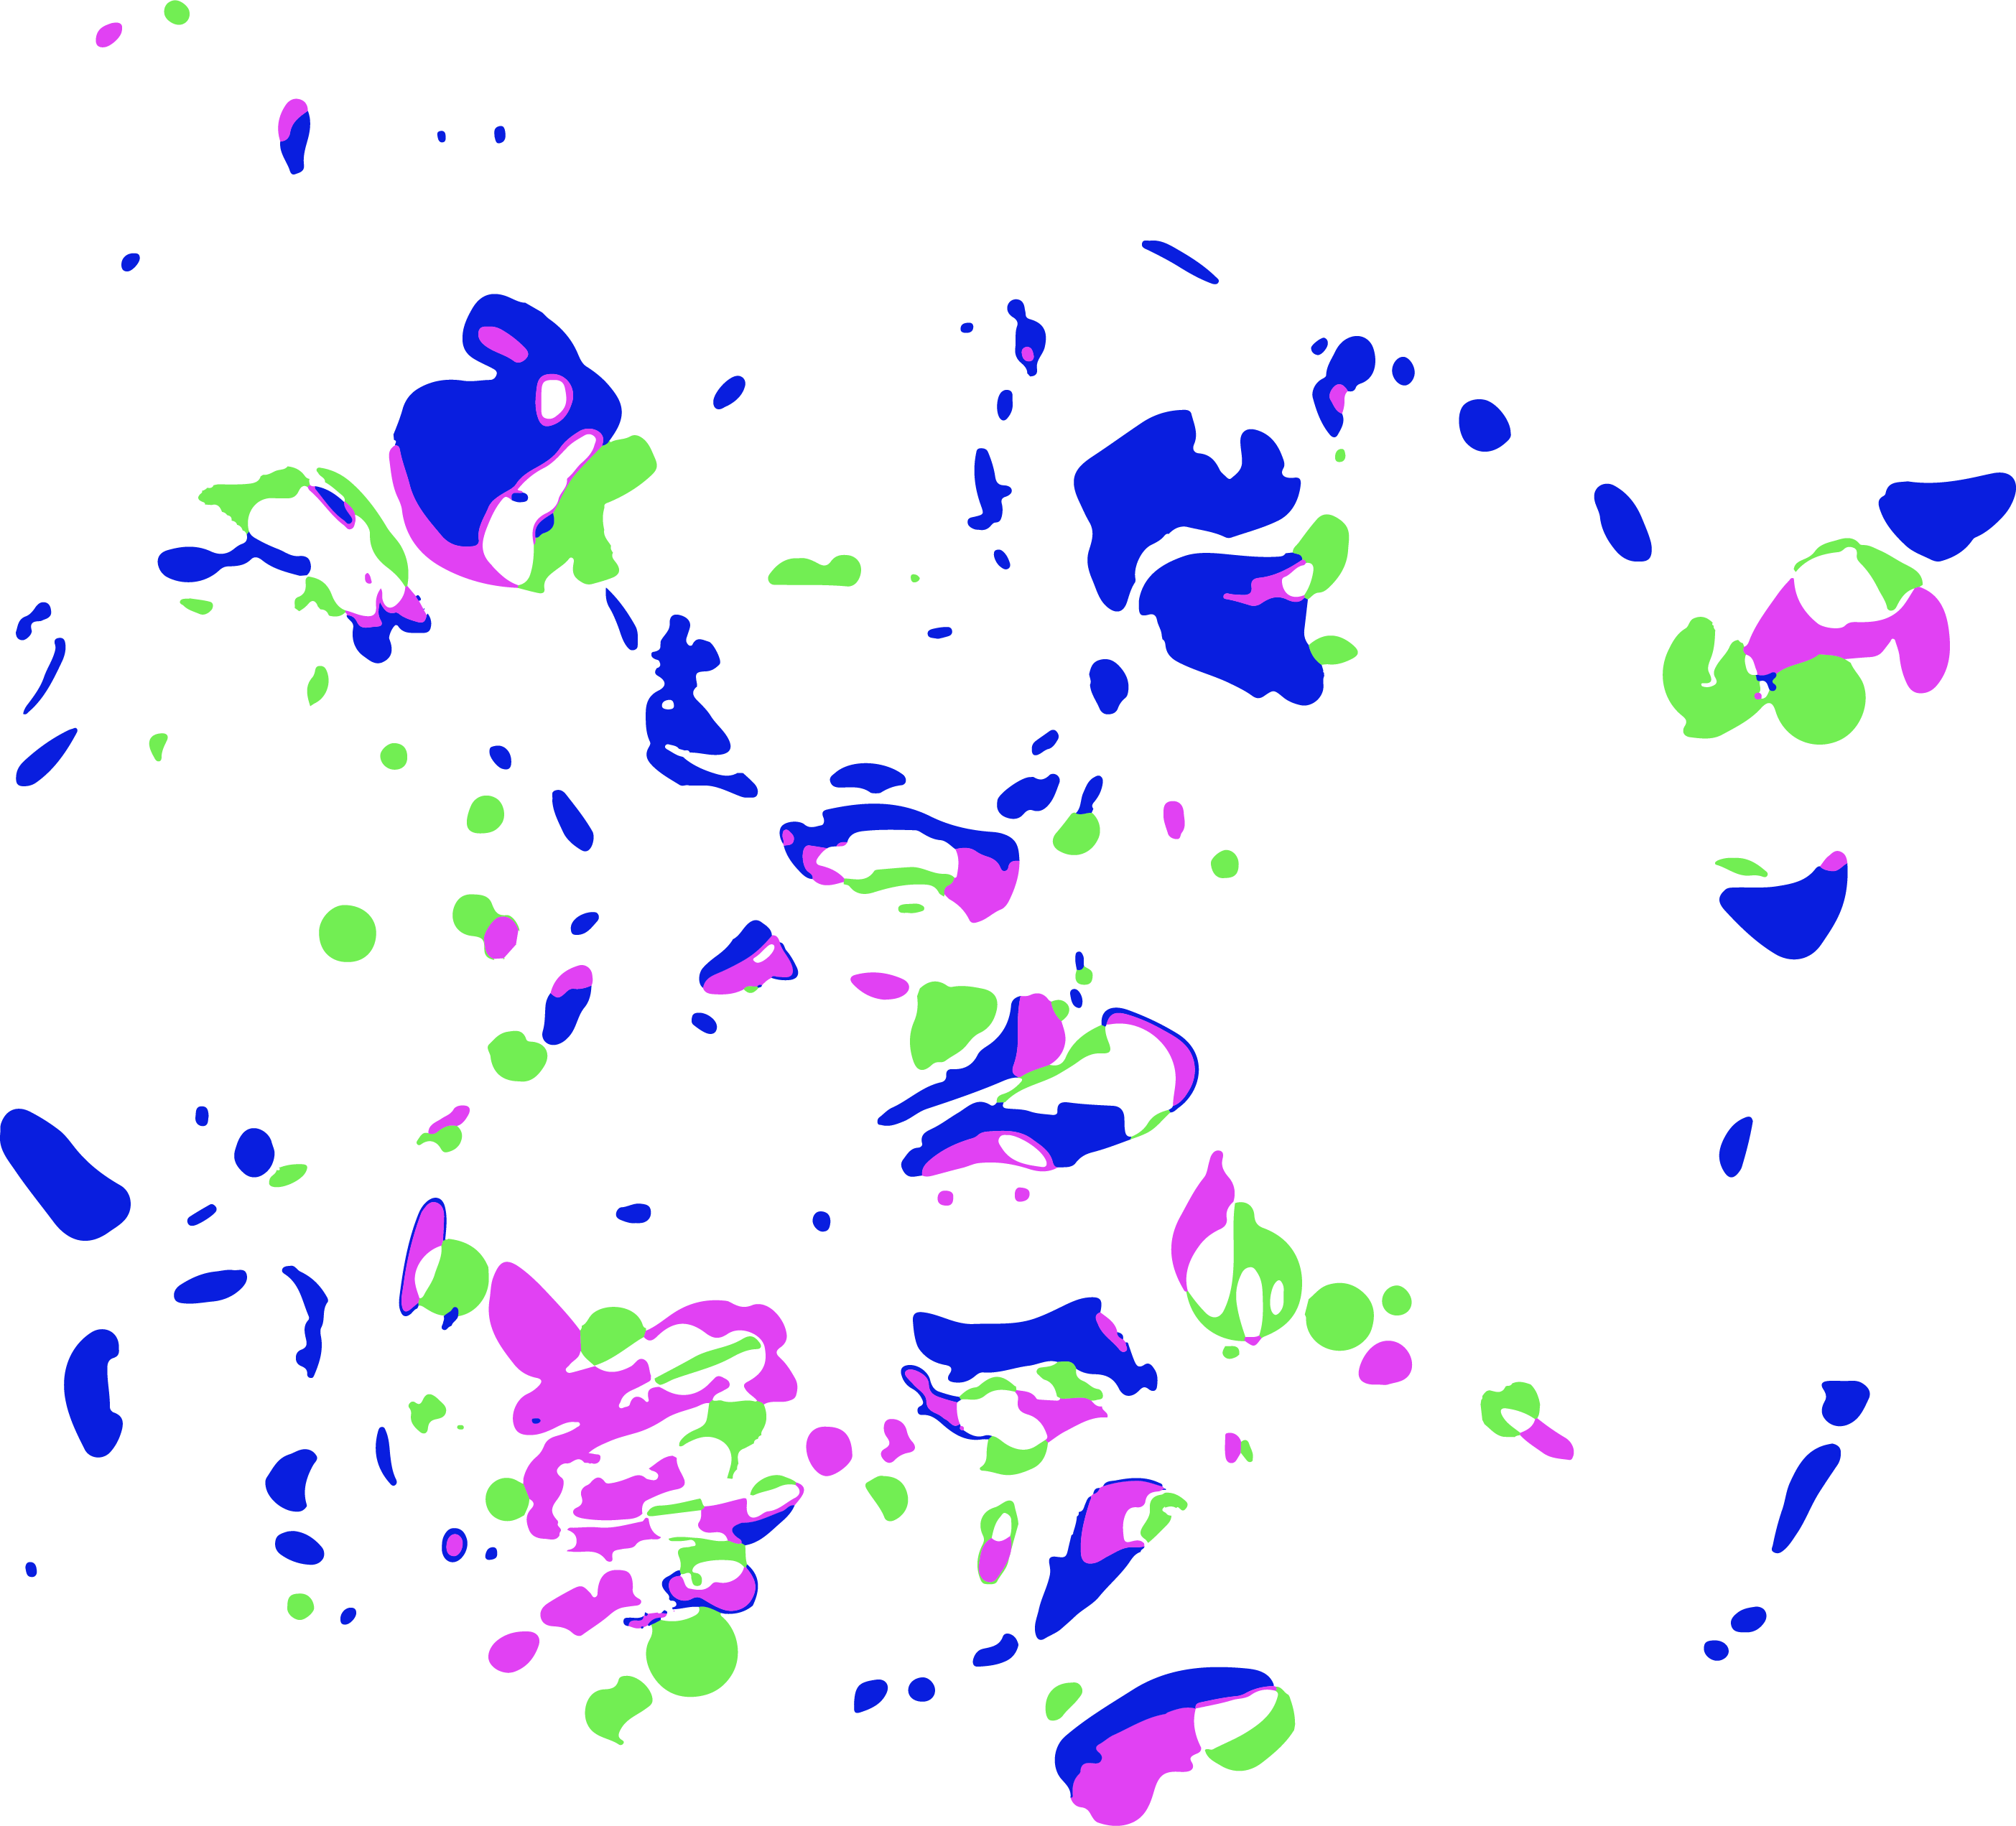
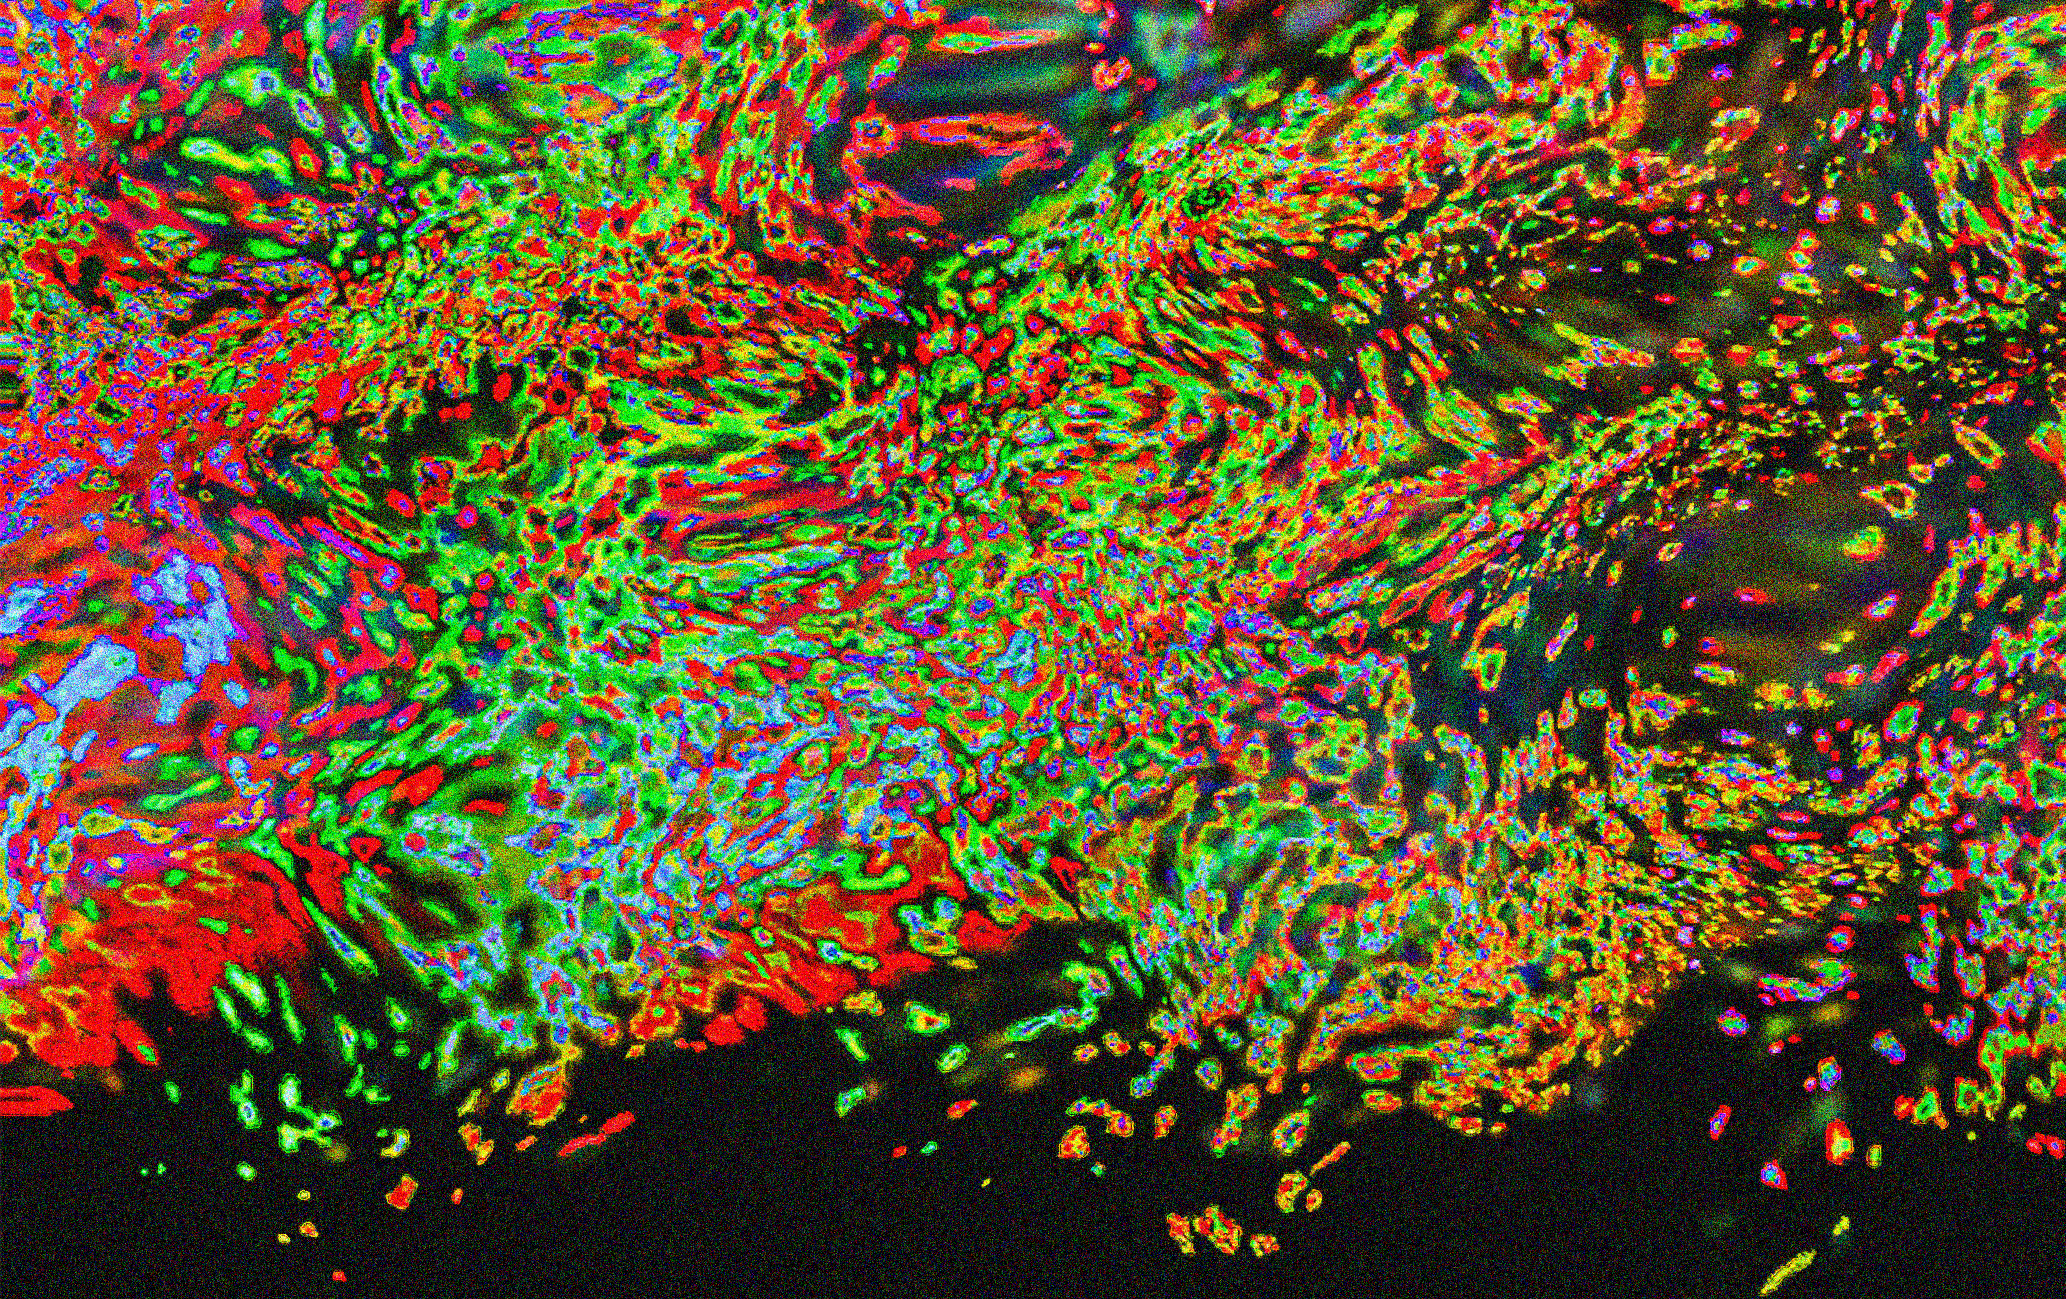
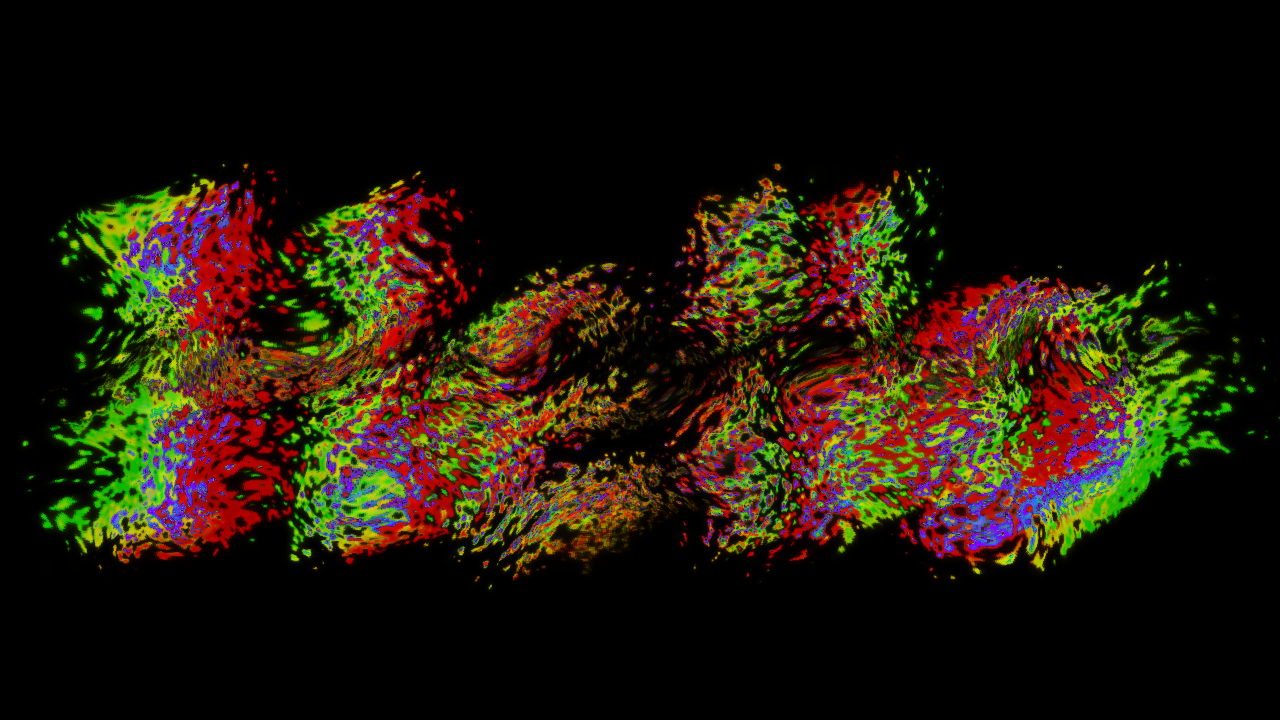
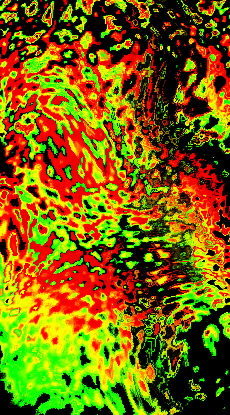
COLOUR SPECTRUM
The use of colours is one of the key visual approaches to visualising personality. The
full-colour spectrum is being used in the visualisation to portray the wide and complex range of personality traits. With reference to colour psychology, colours withhold representative abilities as it influences human perceptions. In this sense, colours are being utilised as a form of representation for vocal pitch. The higher the vocal pitch, the warmer the hue and saturation of the typography, while a lower vocal pitch will be portrayed in a cooler hue and saturation typography.
Vocal pitch can be represented through one or multiple solid colours or even a gradient of colours. The fluctuations in vocal pitch that are detected through the voice analysis deck are represented using a combination of colours. This is to accurately reflect the changes and complexity of our voices.
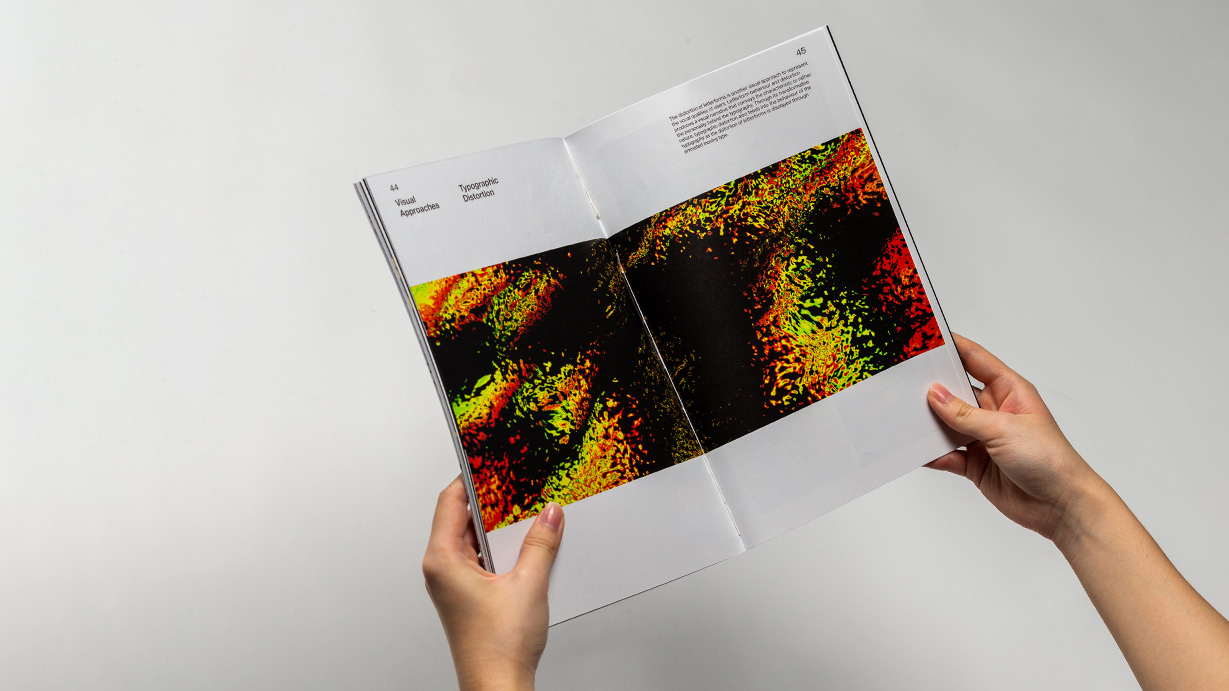
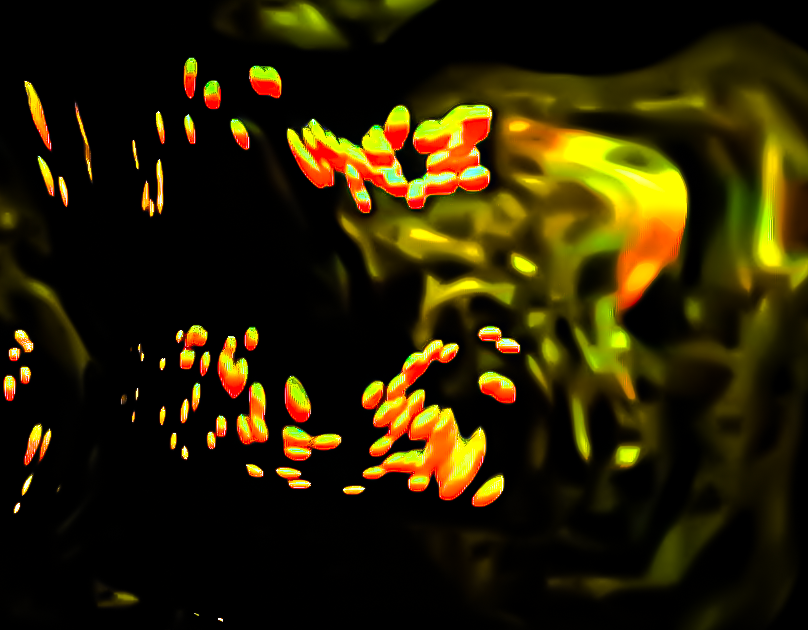
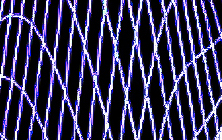
TYPOGRAPHIC
DISTORTION
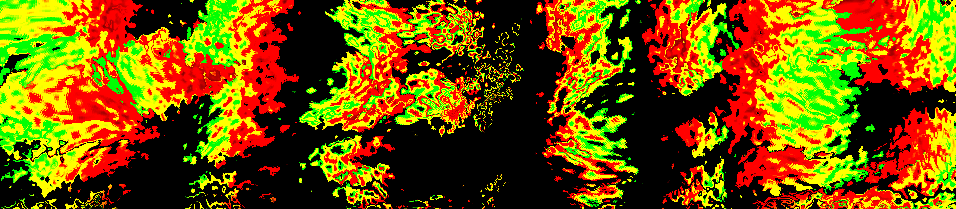
The scale of distortion connotes the vocal frequency. Values from the vocal frequency graph are mapped onto the noise factor of the letterform. The higher the frequency, the more distorted the letterform becomes. Letterform distortion reaches a maximum when the typography disperses and is illegible. Whereas at a low frequency, the letterform solidifies into spheres which makes the typography more legible.
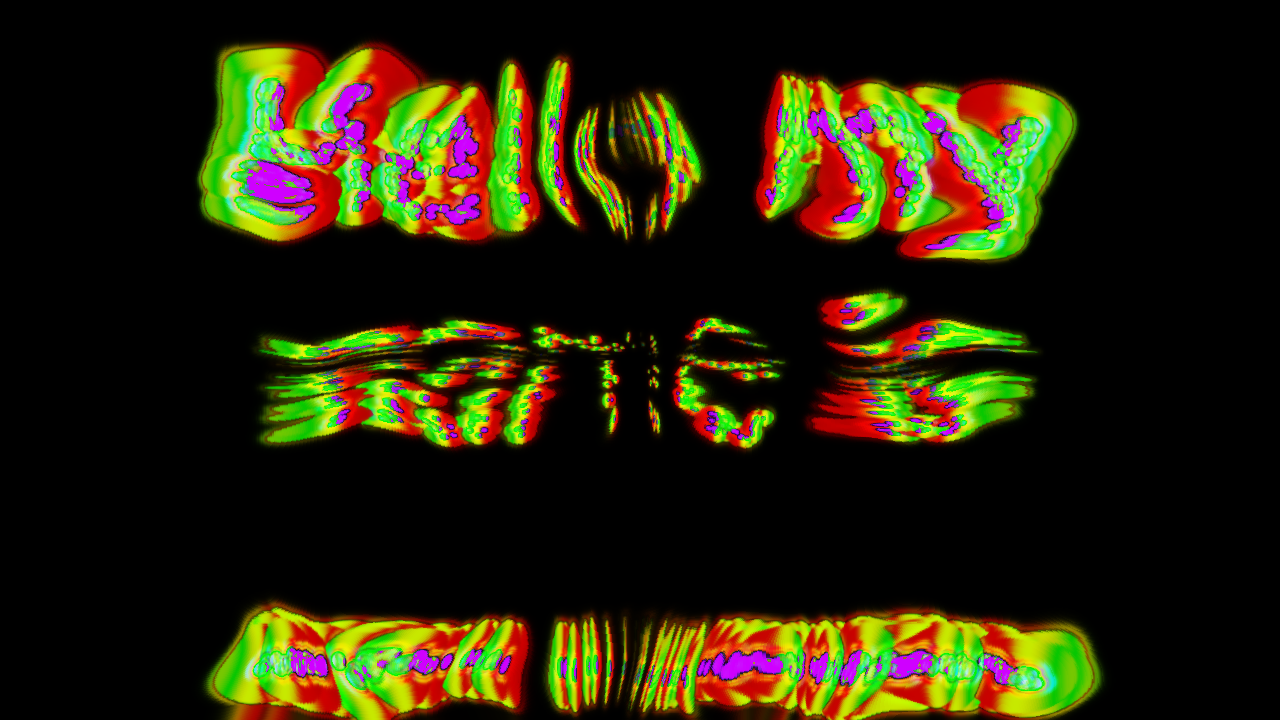
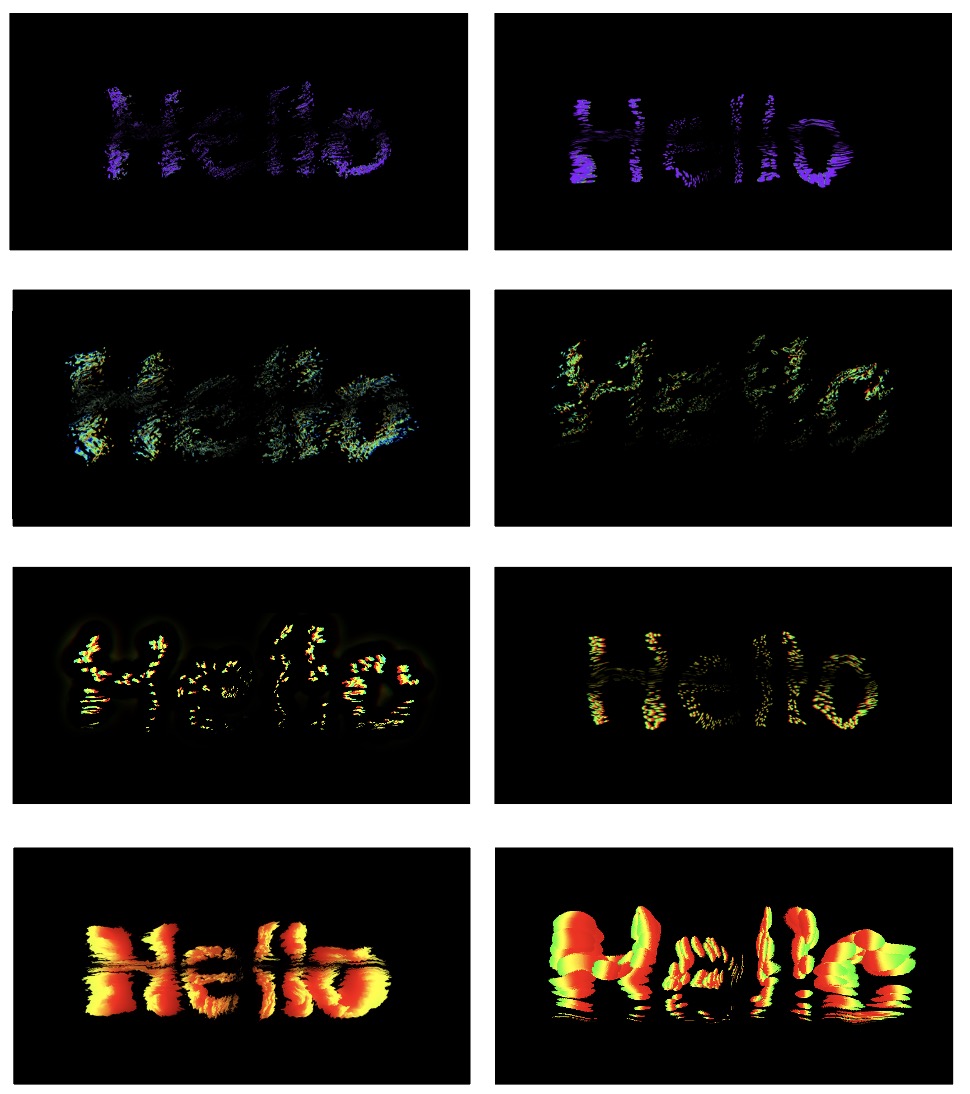
The typographic distortion is manipulated based on the pitch level, while the scale and movement of the typography are controlled by the volume and frequency of speech respectively. As vocal characteristics fluctuate while speaking, the typography animates accordingly, adapting to the flow of speech to mimic the unique vocal soundwave of the participant. In doing so, this forges a visual replica of the voice’s behaviour and attitude which in turn reflects the personality ingrained within these voices.
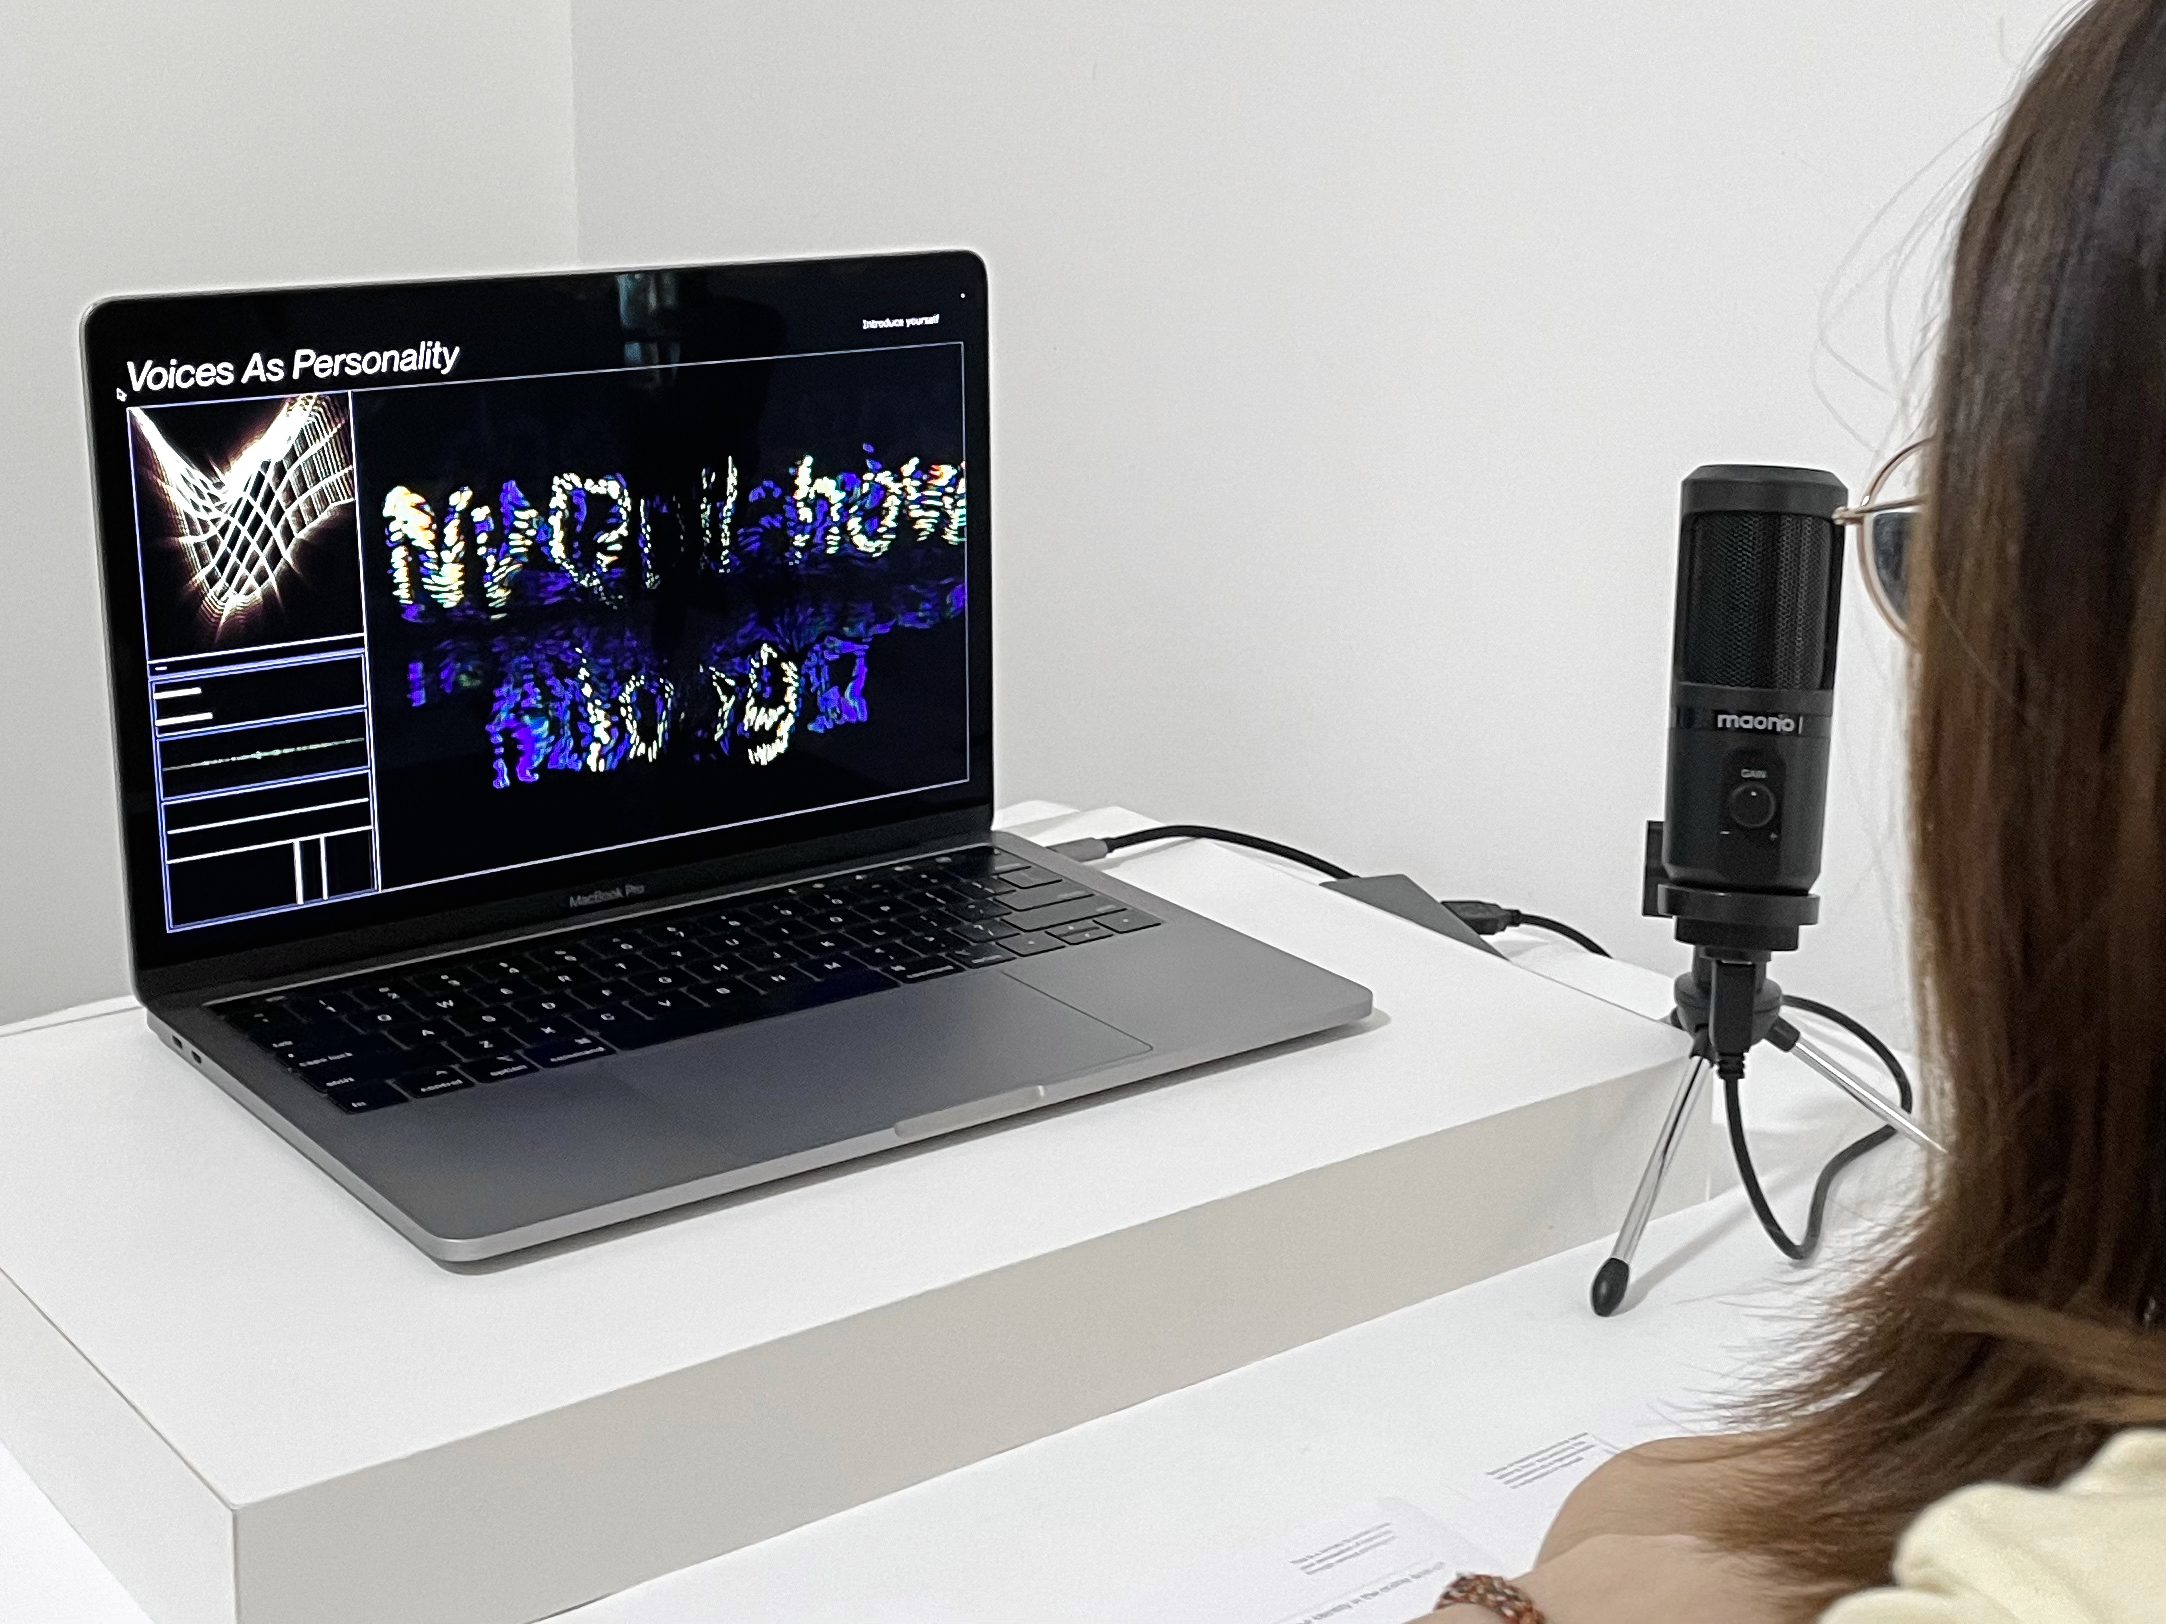
EXPERIENCE
To begin, participants are to give a short introduction of themselves when speaking into the microphone as a self-report measure to modulate a level of consistency across speech inputs.
The spoken words are processed using the speech recognition algorithm powered by the Google Cloud Speech-To-Text API. The spoken words are translated into text which are used as input values for typographic distortions to take place.
The dataset containing vocal patterns are processed through a generative interface to develop a series of voice-reactive typefaces that is representative of the participant’s vocal characteristics. The typographic outcome is displayed alongside the voice analysis deck to serve as a visual comparison between the data input and generated visuals.
USER-TEST
Results from the SIPI evaluation revealed an average rating of 82.5%, and 87.5% in garnering a sense of identification which is the highest rating across all prototypes (refer to Appendix C). This indicates that the prototype is well-received as an identity tool and is most effective in developing a sense of identification with participants. The high SIPI score can be acreddited to the visual intuitivity of the generative typeface as participants were able to discern the personality type and energy level based on the colours and spread of typographic distortion respectively (refer to Appendix B).
Nonetheless, some feedback that the inclusion of font-based reactivity may increase the uniqueness of the letterform to reflect additional layers of personality and formulate a typographic outcome that is more individualised and in-tune with the participant. In comparison to the preliminary documentation, there is a significant increase of 10% in the participants’ perception of voices as a core element of their identities (refer to Appendix C). This signifies that visualising the intangibility of our voices substantiated a positive effect in the intertwinement of verbal and visual cues to represent one’s identity.
→ Appendix B
→ Appendix C
BEHAVIOURAL
CONSTRUCTS
BEHAVIOURAL
CONSTRUCTS
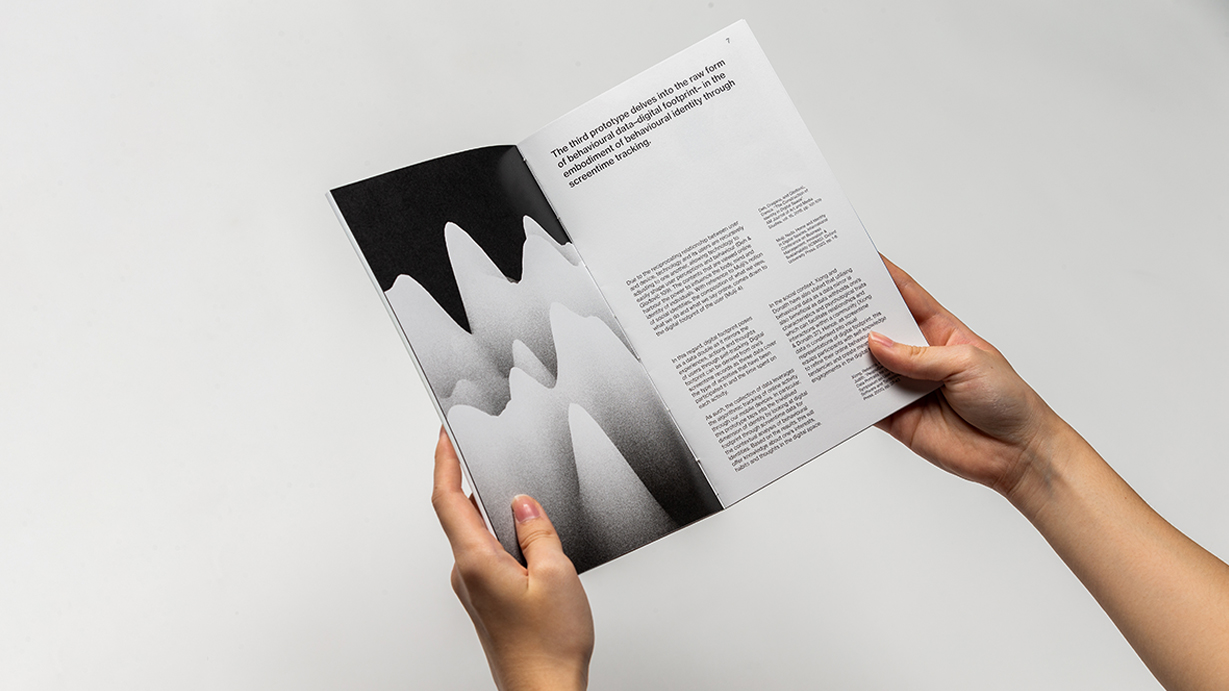
The third prototype delves into the raw form of behavioural data–digital footprint– in the embodiment of behavioural identity through screentime tracking.

Due to the reciprocating relationship between user and device, technology and its users are recursively adjusting to one another, allowing technology to easily shape user perceptions and behaviour (Deh & Glođović 109). The contents that are viewed online harbour the power to influence the body, mind and identity of individuals. With reference to Mulji’s notion of social identities, the composition of what we view, what we do and what we say online, comes down to the digital footprint of the user (Mulji 4).
In this regard, digital footprint poses as a data double as it mirrors the experiences, actions and thoughts of users through self-tracking. Digital footprint can be derived from one’s screentime records as these data cover the type of activities that have been participated in and the time spent on each activity. As such, the collection of data leverages the algorithmic tracking of online activity through our mobile devices. In particular, this prototype taps into the trivialised dimension of identity by looking at digital footprint through screentime data for the contextual analysis of behavioural identities. Based on the results, this will offer knowledge about one’s interests, habits and thoughts in the digital space. In the social context, Xiong and Donath have also stated that utilising behavioural data as a data mirror is also beneficial as data withholds one’s characteristics and psychological traits which can facilitate relationships and interactions within a community (Xiong & Donath 37). Hence, as screentime data is condensed into visual representations of digital footprint, this equips participants with self-knowledge to refine their online behavioural tendencies and create meaningful engagements in the digital space.

Being informed about our past, present and future activity trends can spur self-discovery, inciting the act of reflection, rectification and reformation of our online behaviours.
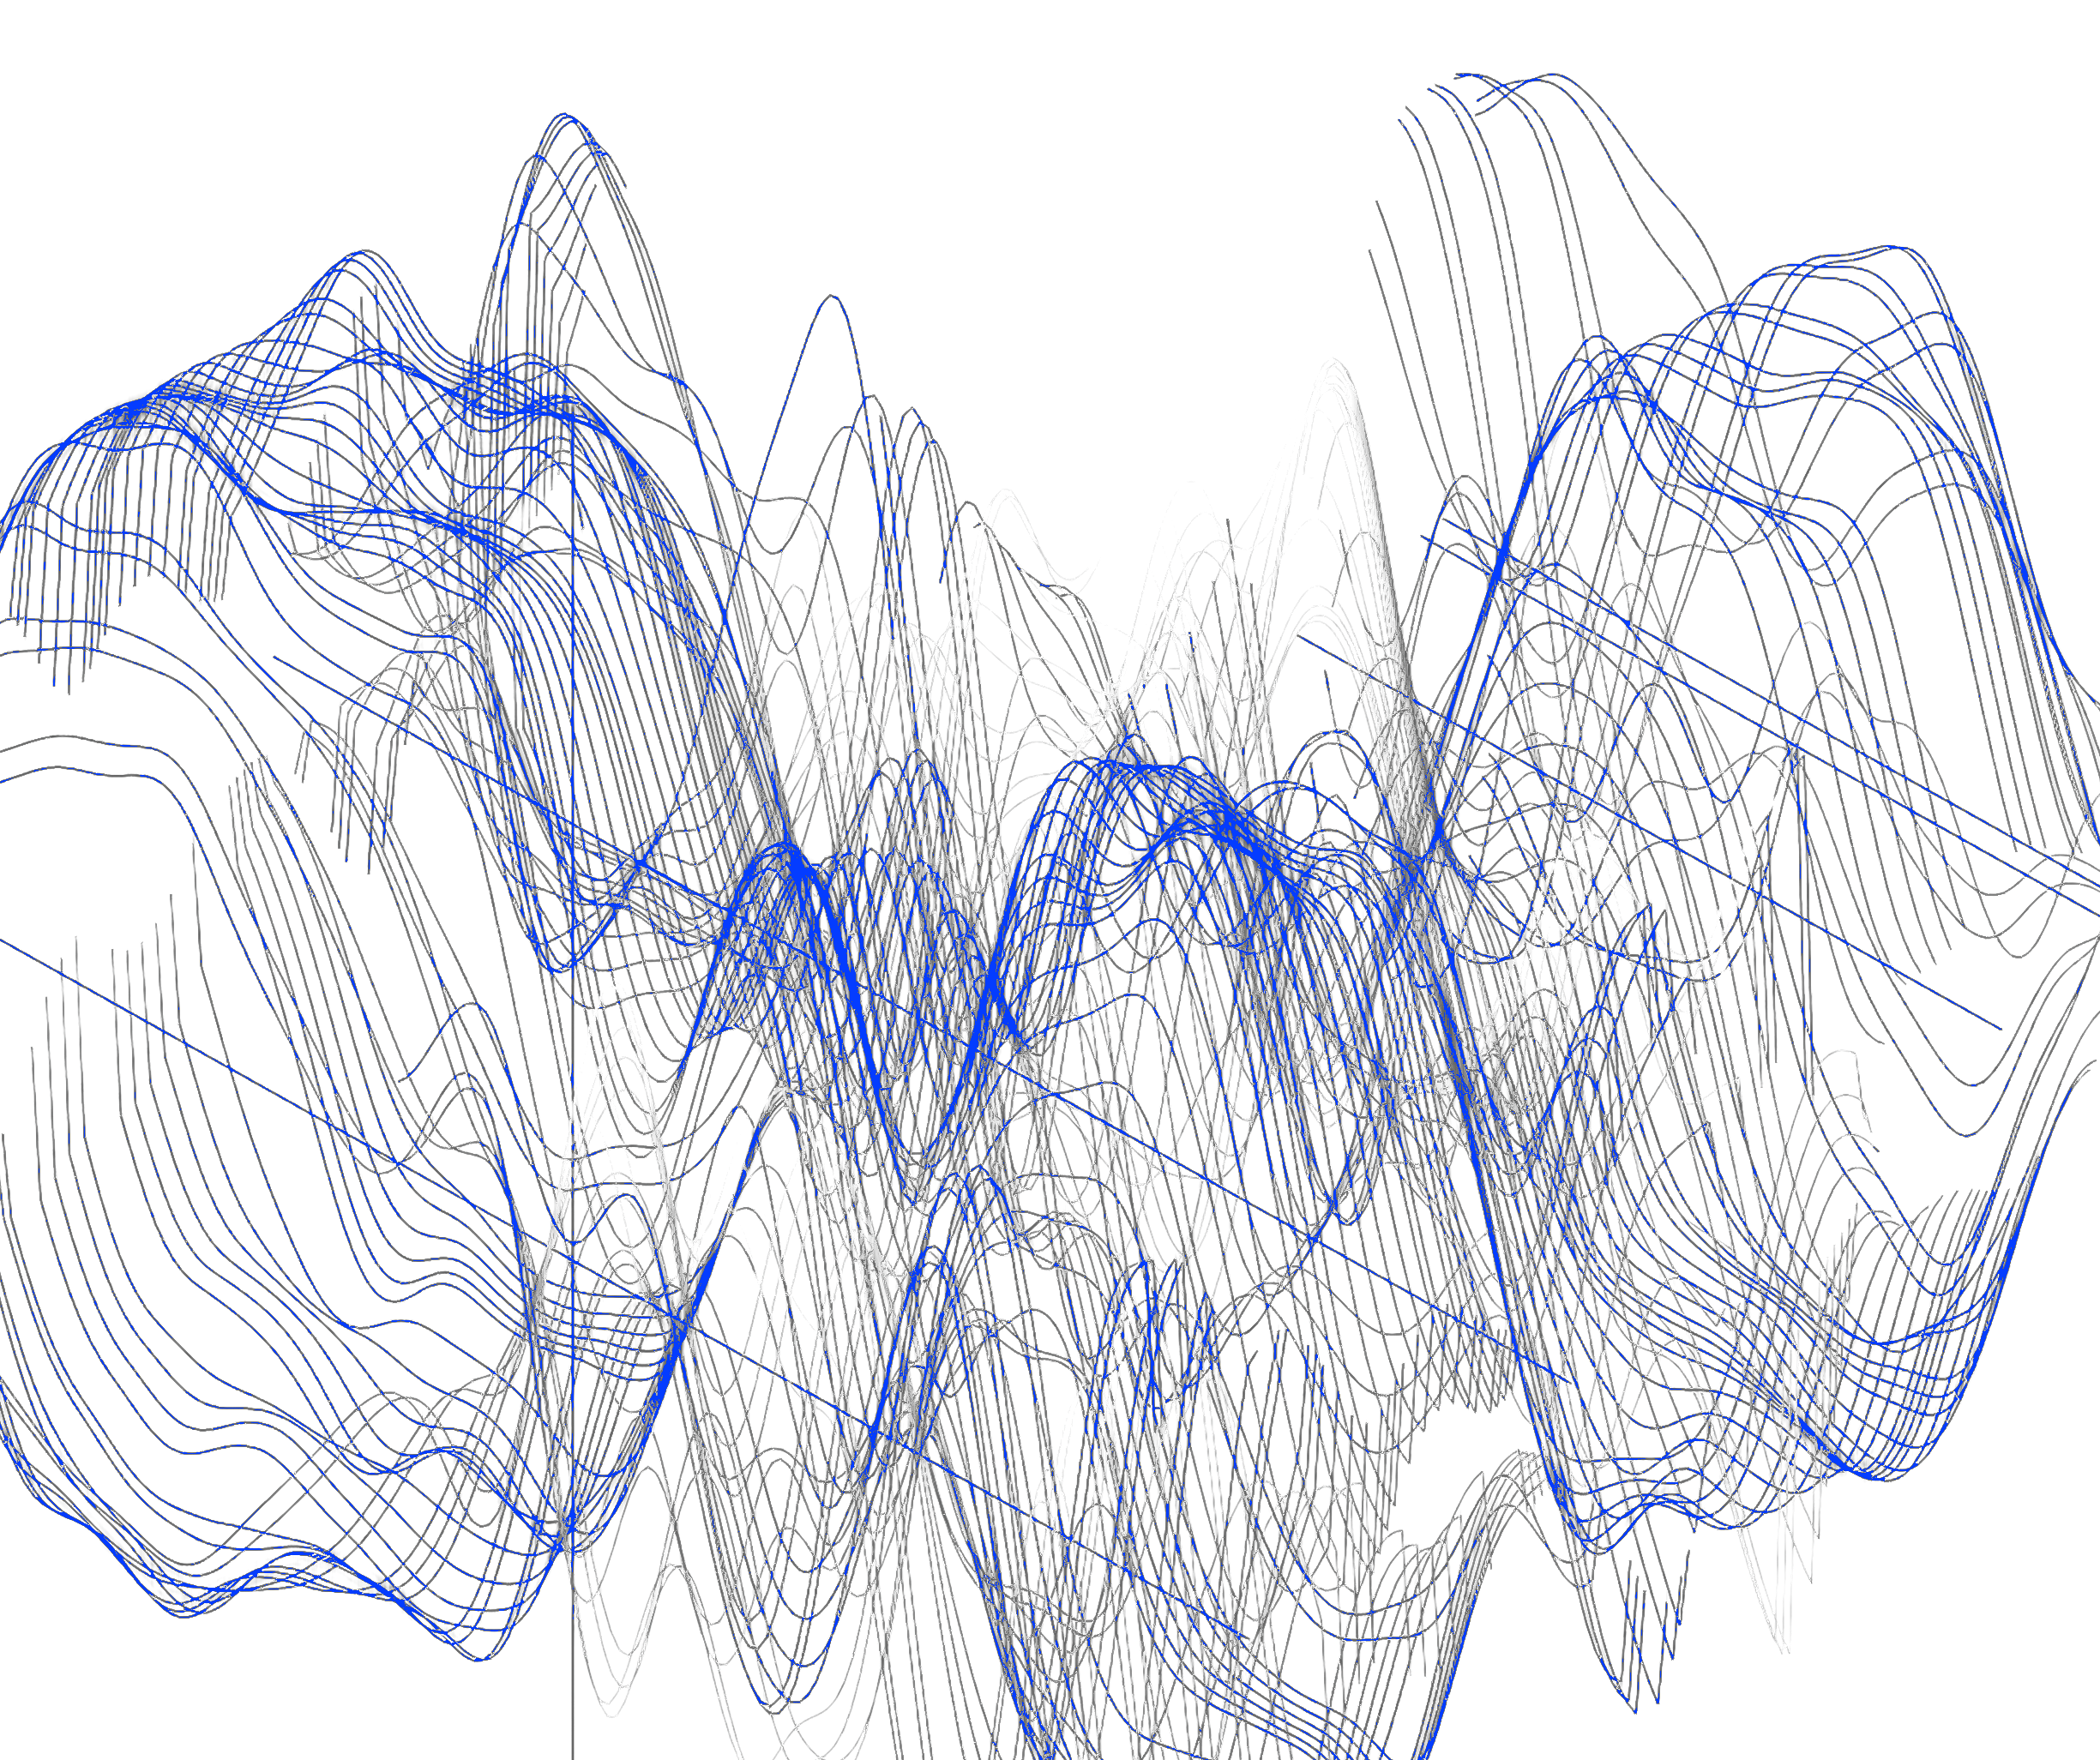
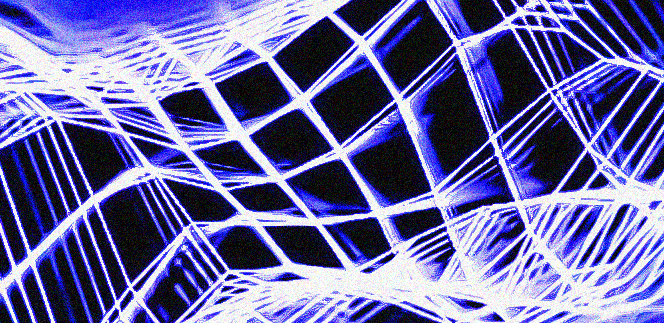
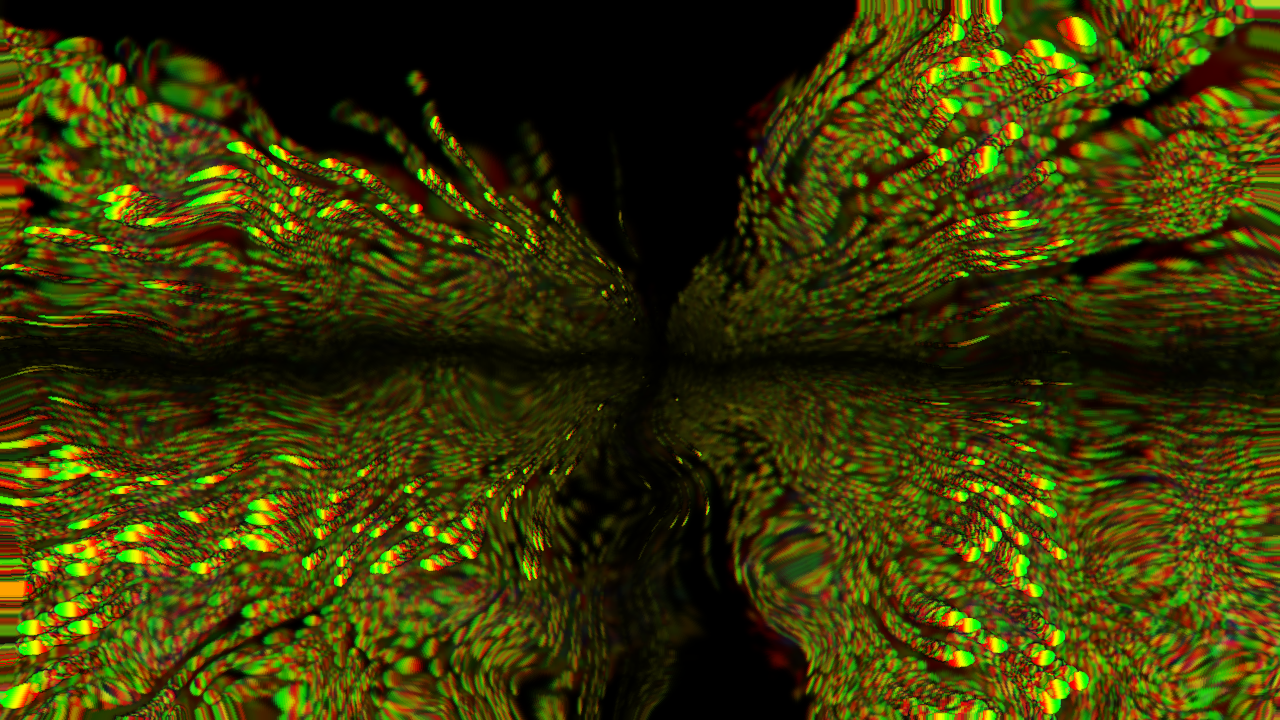
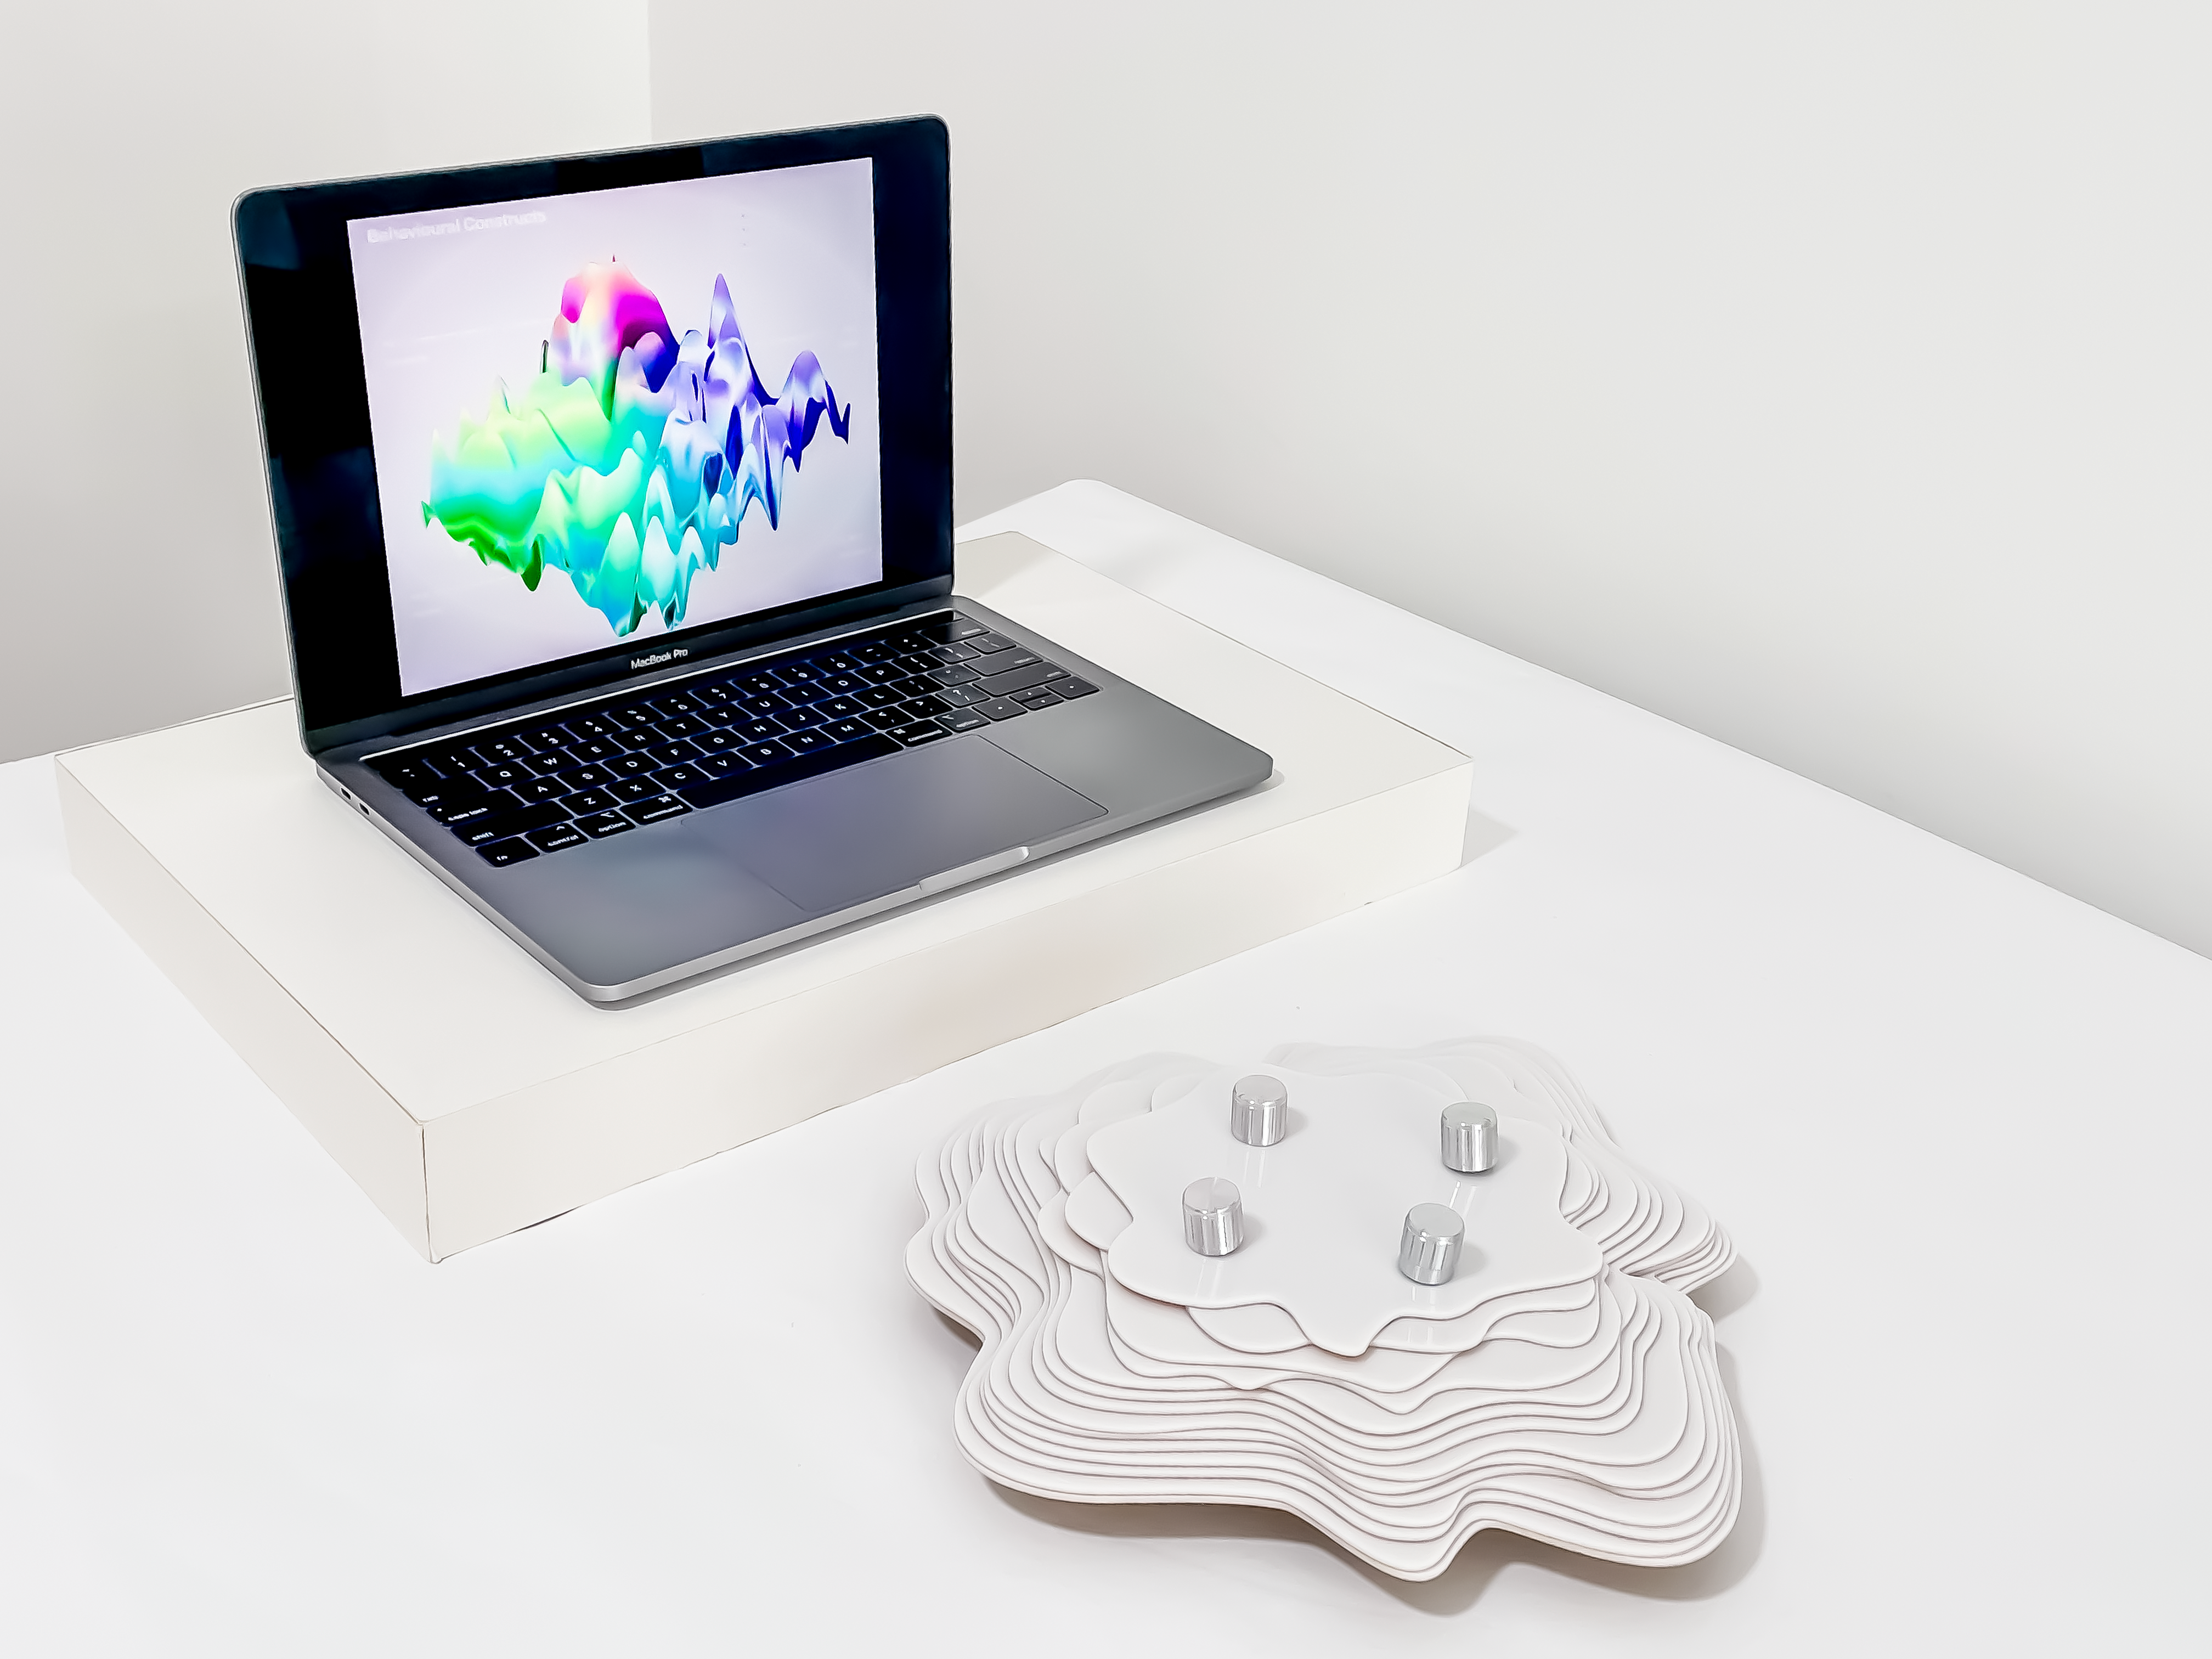
The Behavioural Constructs visualisation distorts and grows in scale as the participant logs in their screentime data. Different configurations of the visualisation can symbolise the trends in one’s habits and experiences, through which participants are able to gain a perception of their overall behavioural identity.
Visualising the weight of their online activity can instil a sense of awareness for their online behaviour. The generated Behavioural Constructs visualisation carries an introspective purpose in fostering self-discovery and examination for participants. When participants are able to visualise the growth of their screentime activity, these observation leads to the reflection of the self. Hence, as screentime data is condensed into visual representations of digital footprint, this equips participants with self-knowledge to refine their online behavioural tendencies and create meaningful engagements in the digital space.
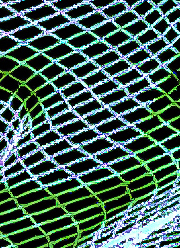

Colours are utilised as a visual approach to differentiate the various screentime categories, guide users in reading their screentime data and identifying their screentime trends. The colours also help to maintain visual balance to avoid looking too much like a landscape.
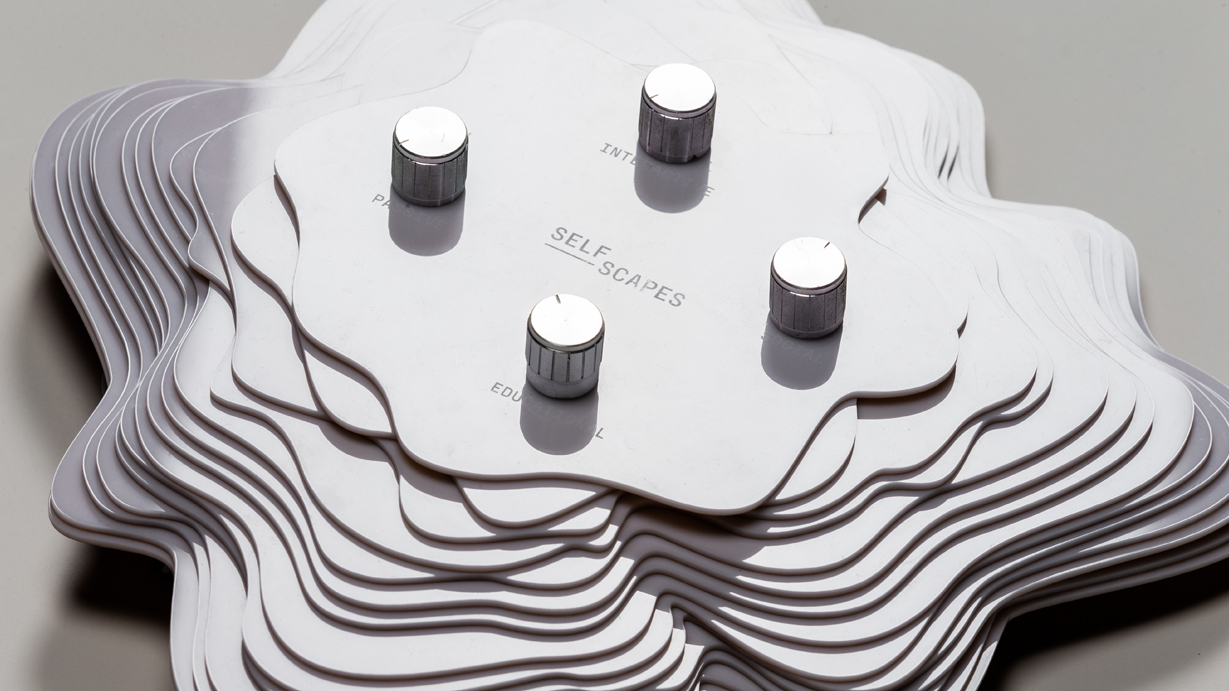
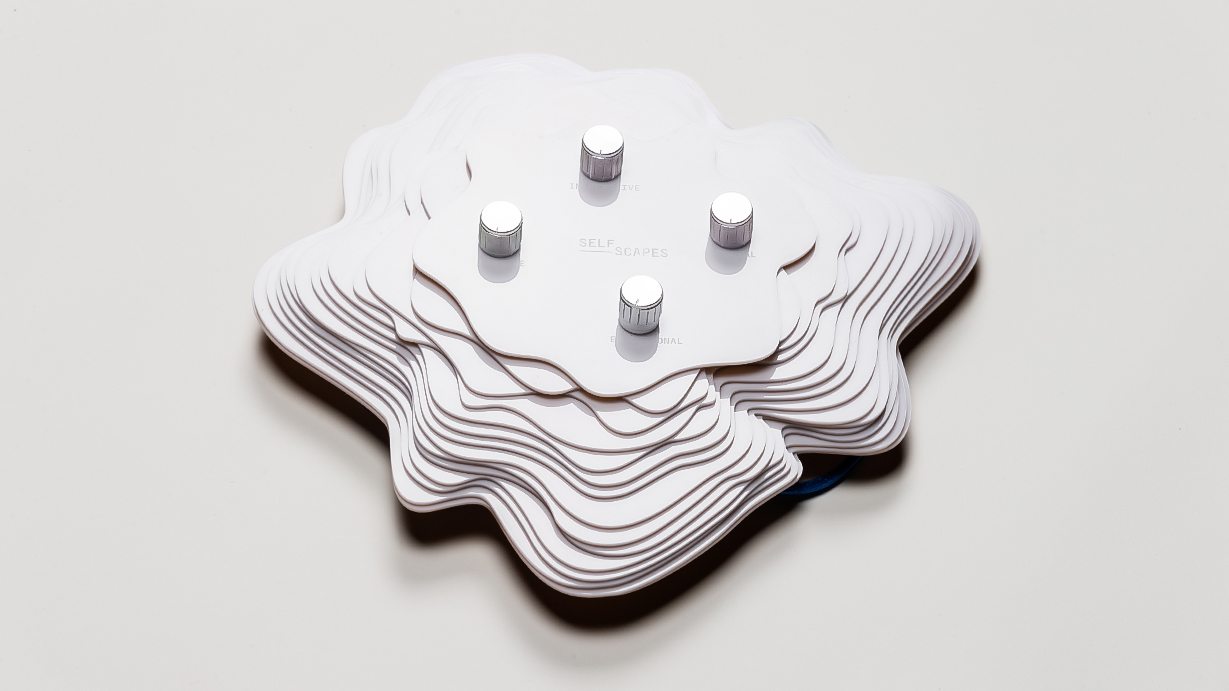
Four potentiometers are used as input points to collect screentime data, with each representing a screentime category. The rotational values from the potentiometers are translated into the number of hours spent on a particular activity, the typical potentiometer range of 0 to 1023 was resampled to a value of 0 to 168, representing the total number of hours in a week. Inputs from the potentiometers are streamed through an Arduino UNO circuit which then sends data into Touchdesigner using serial communication.
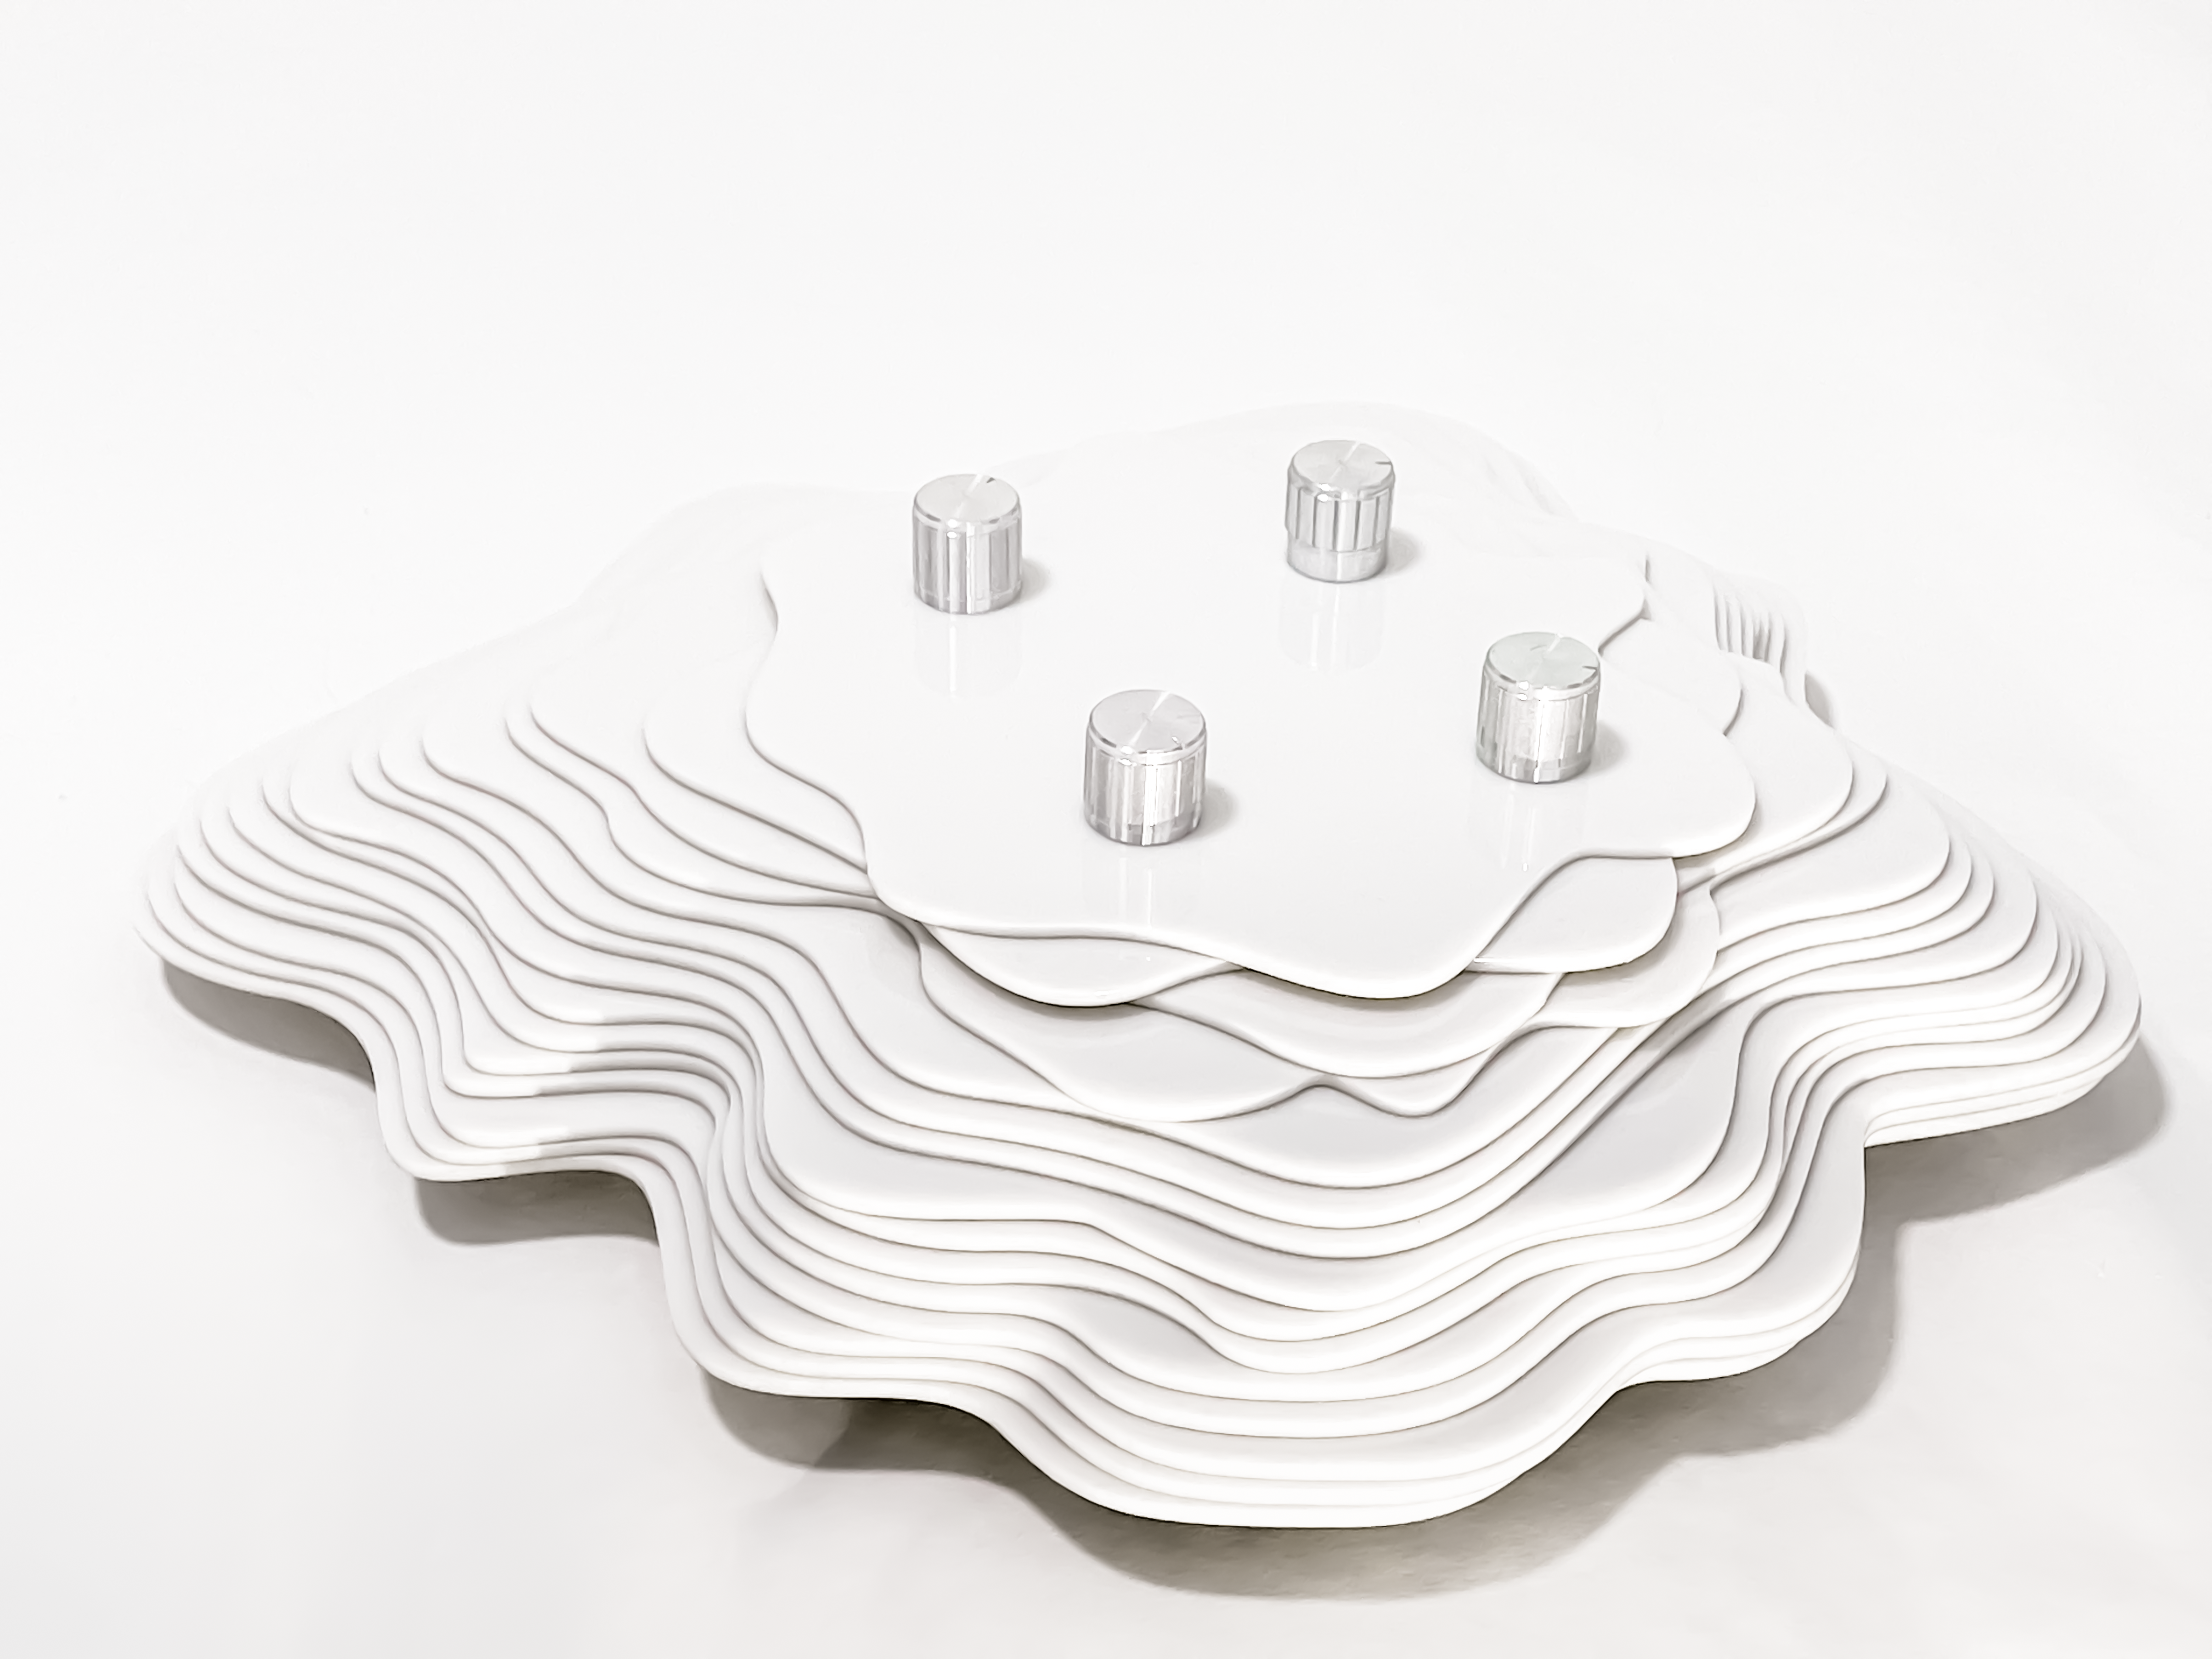
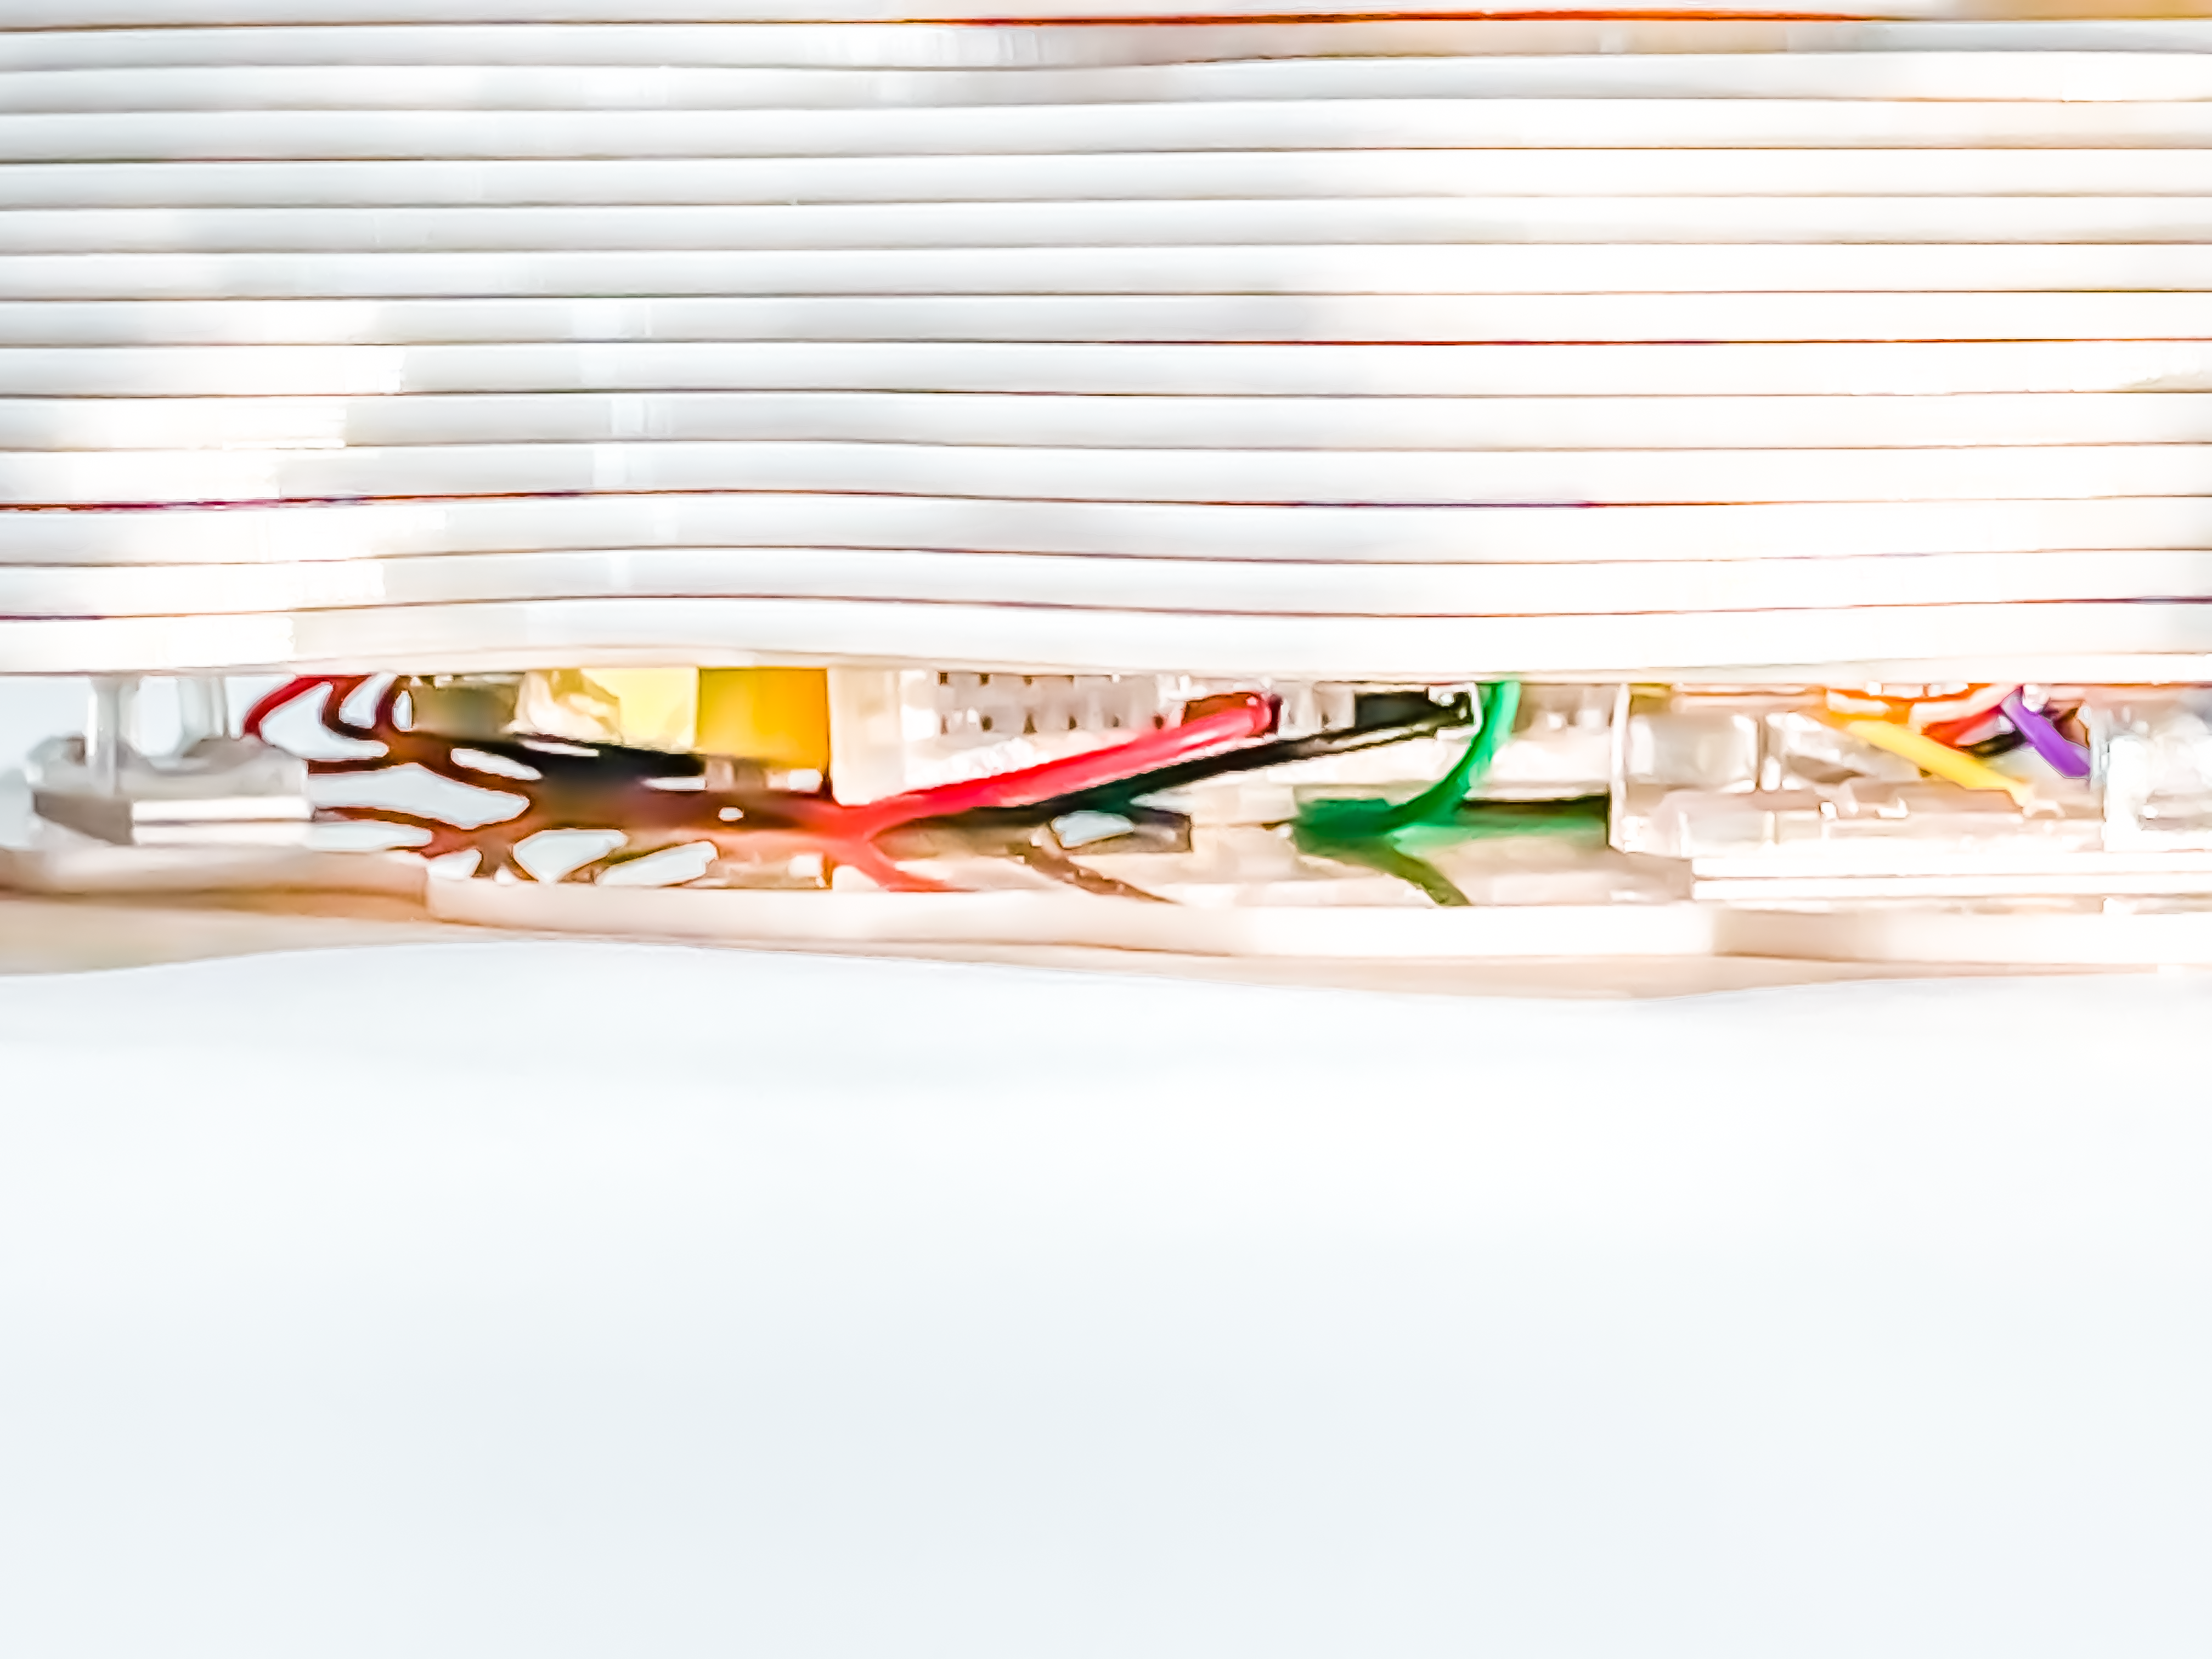
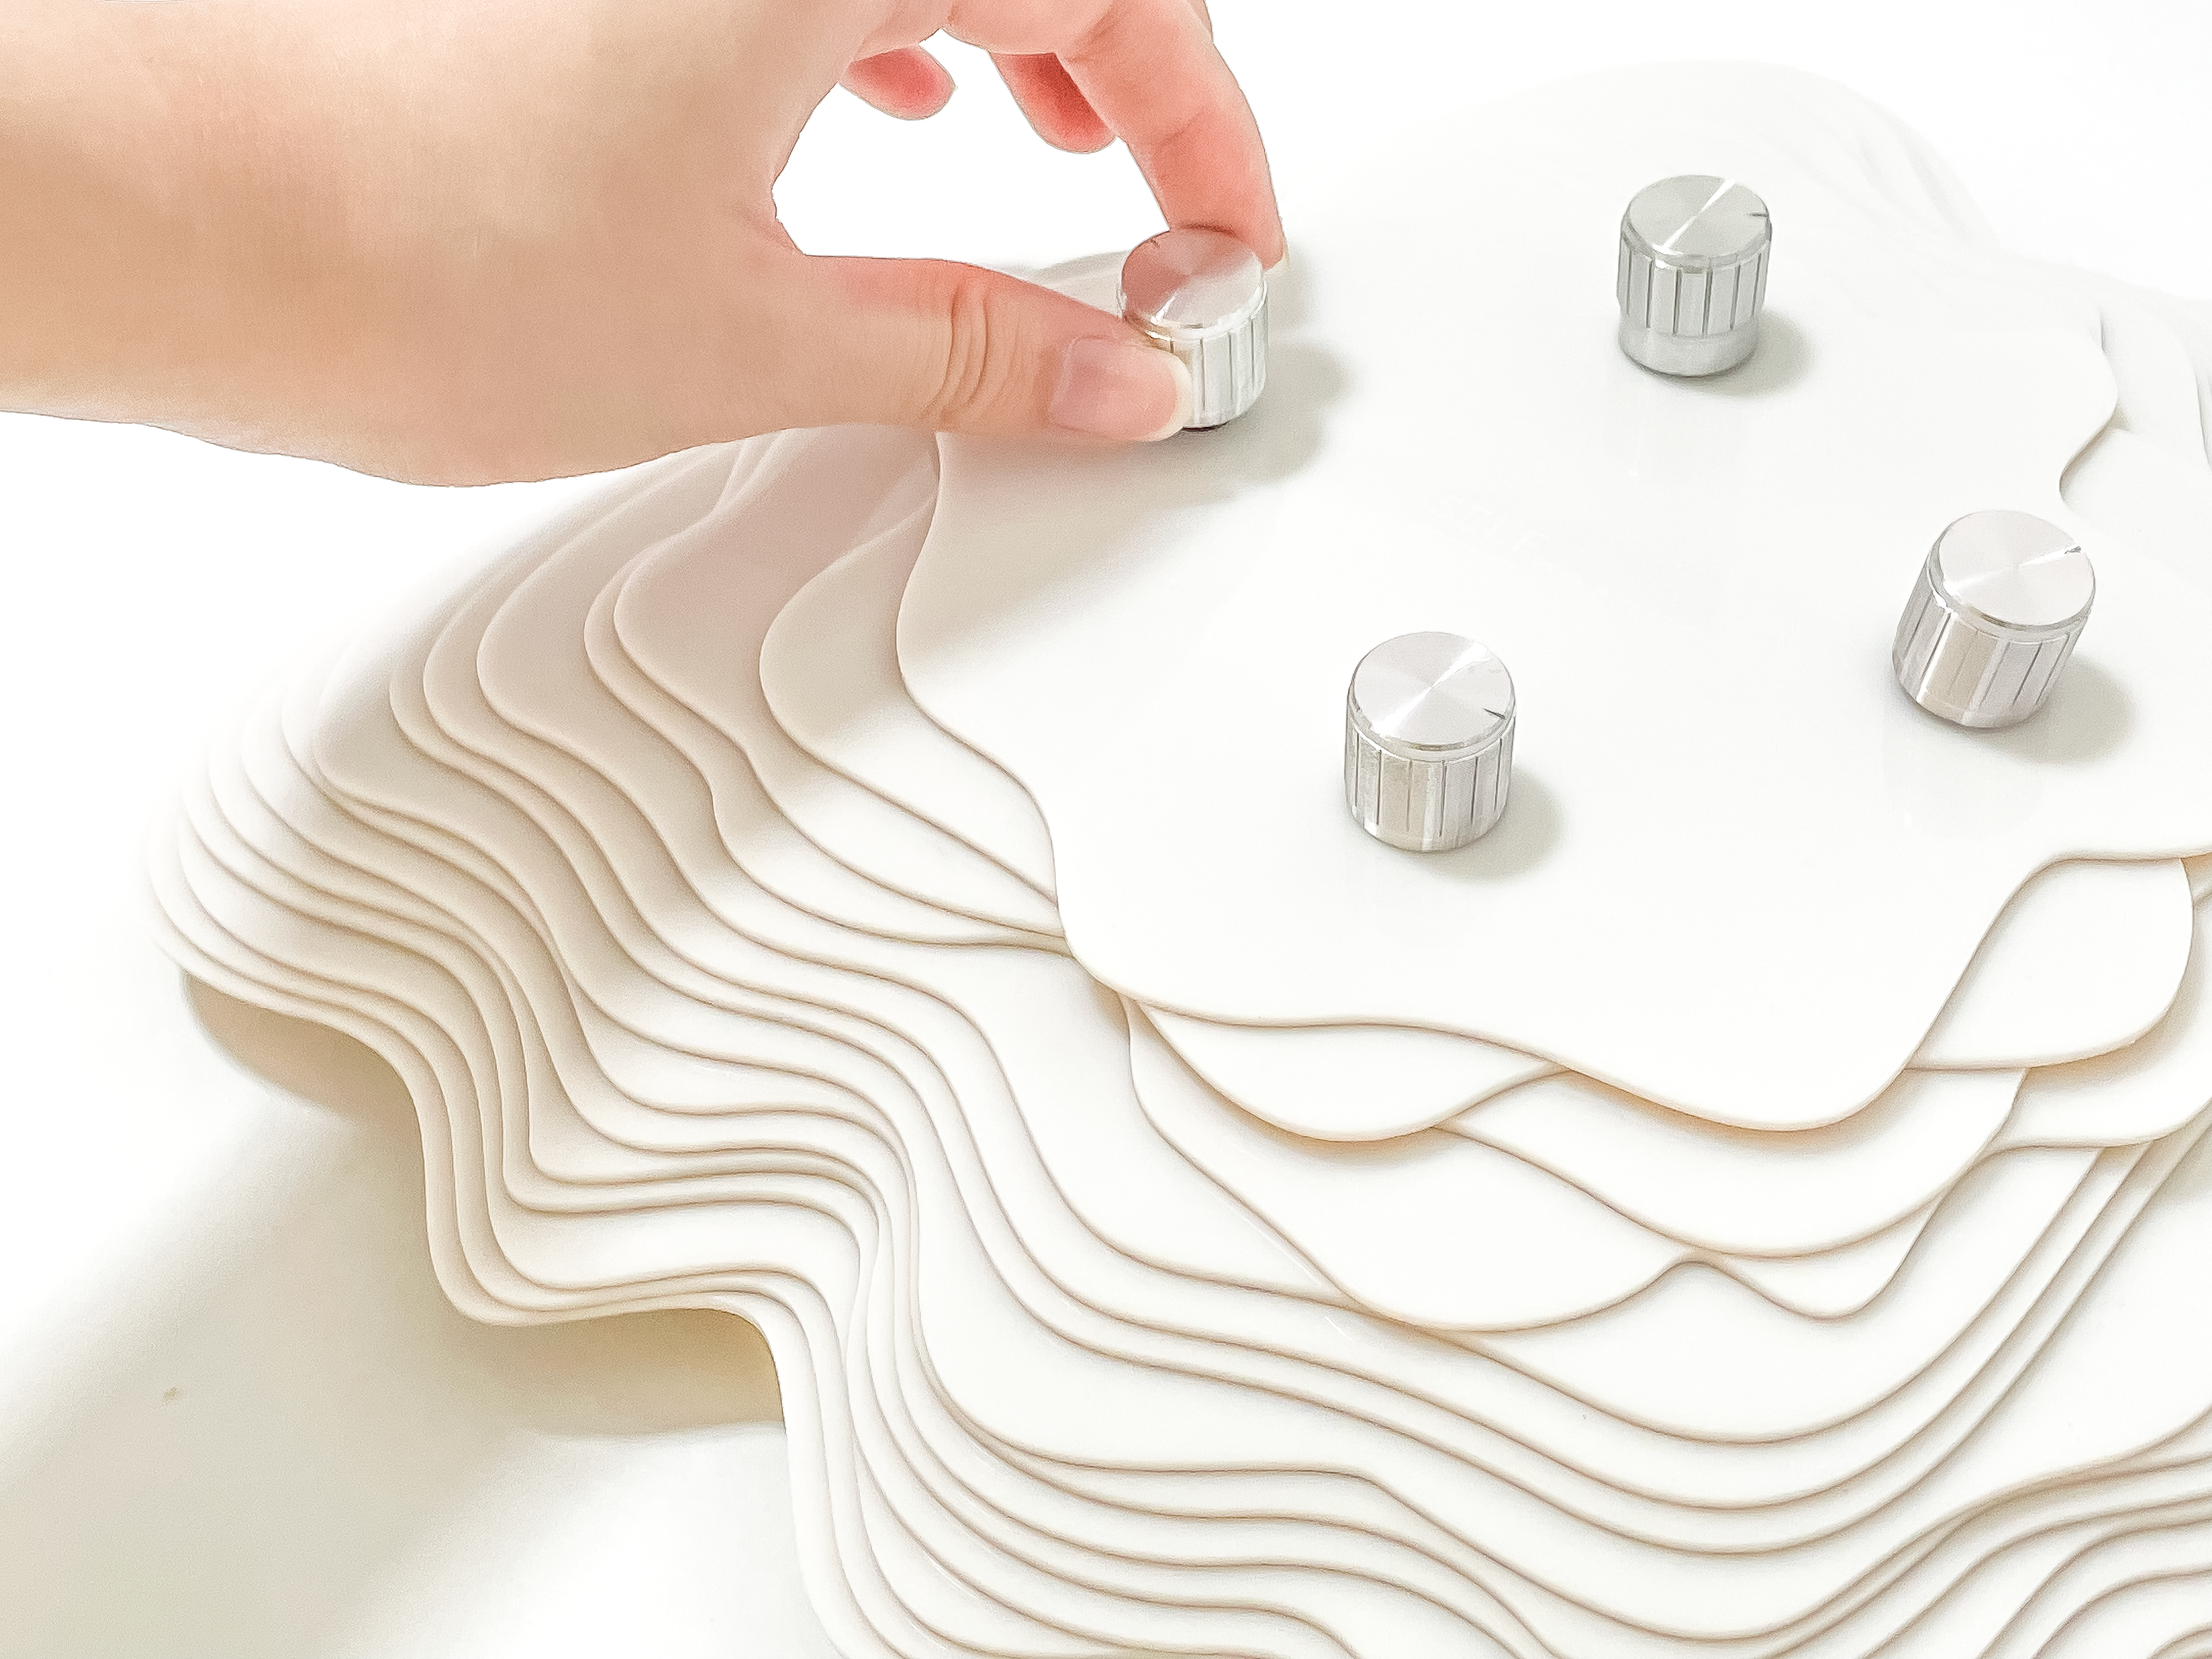
To reflect the visual concept of Behavioural Constructs, organic shapes were explored as a way to approach the physicalisation of the visuals. The fluid screen-based visualisations from the movements of waveforms are being replicated through the use of organic shapes. Each layer is shaped to outline a similar trajectory as the digital visualisation. The holes for the potentiometers are also positioned similarly to the visualisation. Design considerations are made to mimic the visual construction of the digital visualisation. This is to craft a seamless and intuitive packaging that can guide users in interacting with the prototype. In addition, the stacked layers resemble a topographic landscape which helps to drive the overarching narrative for the visuals.
Acrylic is used as the main material for crafting. The designs are first vectorised and transferred to the laser cutting machine. Acrylic layers outlining the shapes are then stacked on top of one another to form the structure. A key design element was added to the structural design so as to avoid changing the circuit layout of the potentiometers. The internal structure is made hollow to create space for the Arduino board, breadboards and potentiometers. 5cm of height or 25 layers of 2mm acrylic sheet was required to fully conceal the entire circuit. However, due to the layering design, the large number of stacked acryllic would also expand the width of the prototype packaging, which was not ideal. Therefore, the number of acrylic was reduced to 15 layers, instead 7mm spacers were used to provide space for the circuit.
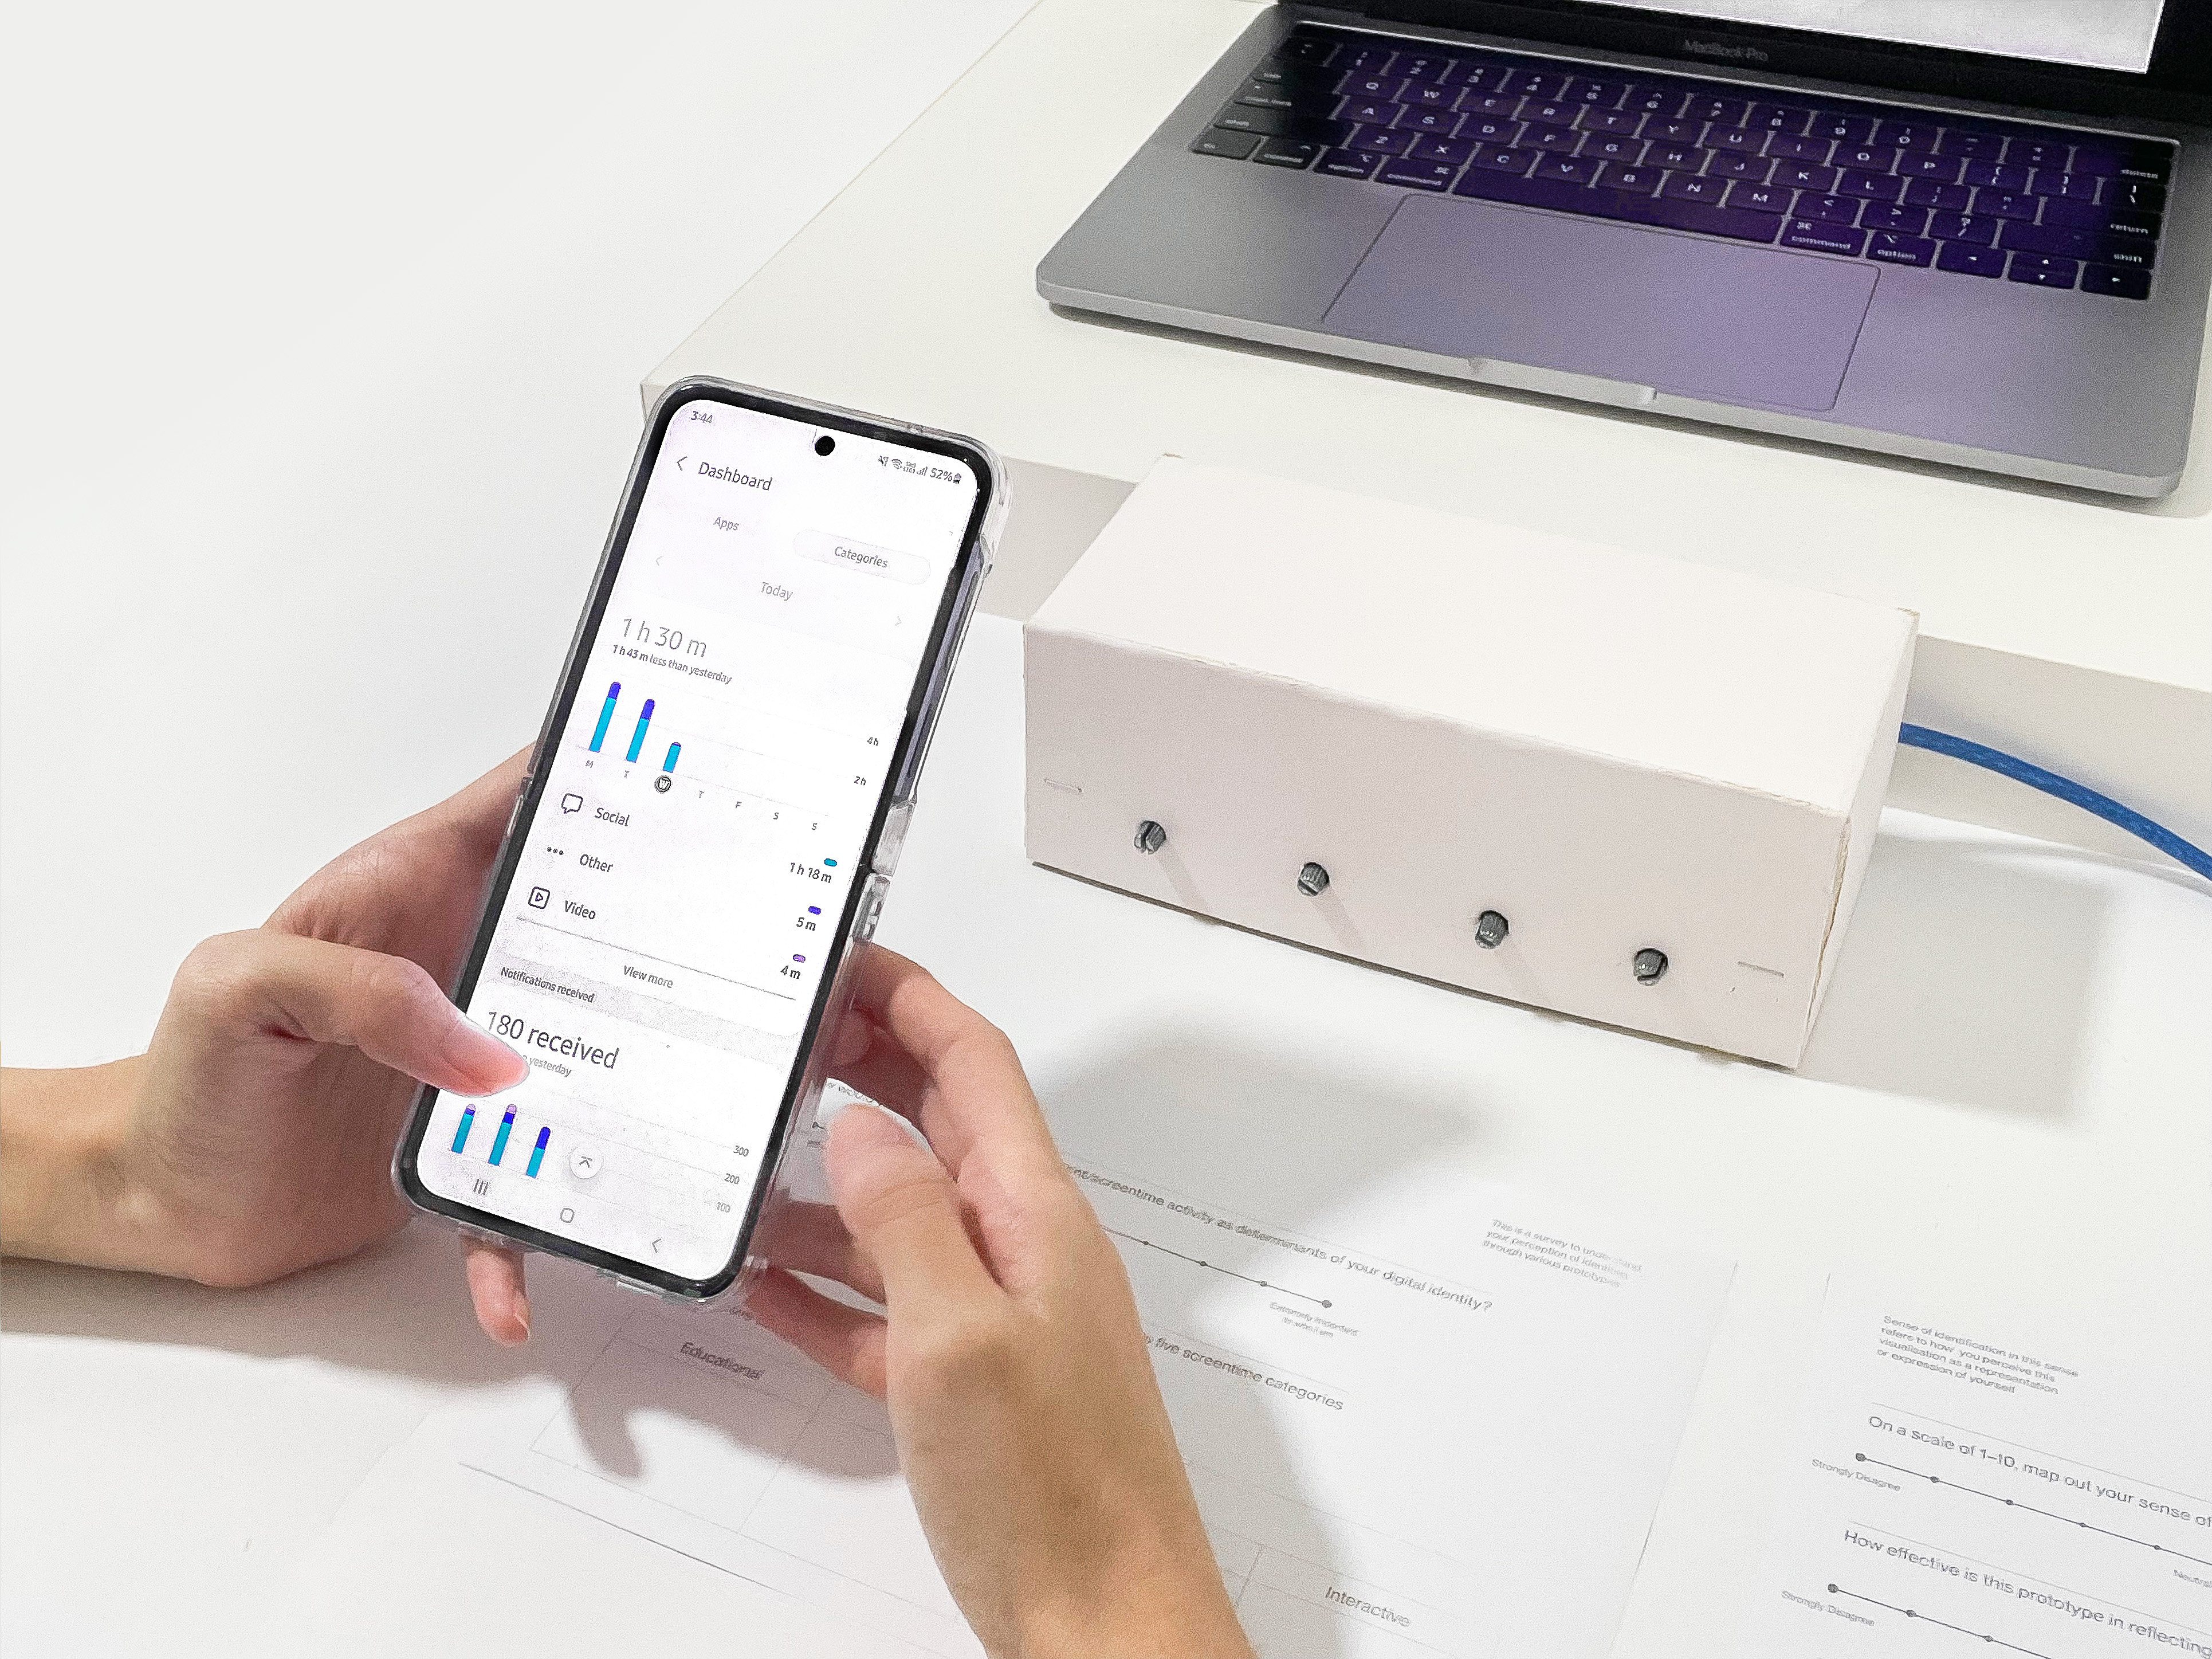
Referencing the four main domains of screentime activity that psychology researchers have outlined, the distortion of the Behavioural Constructs visualisation is split into these four areas, passive, interactive, social and educational (Sanders et al. 1). Using the built-in tracking feature on their mobile devices to record and access their screentime data history, users are able to reference the top four categories/applications used on their mobile devices.
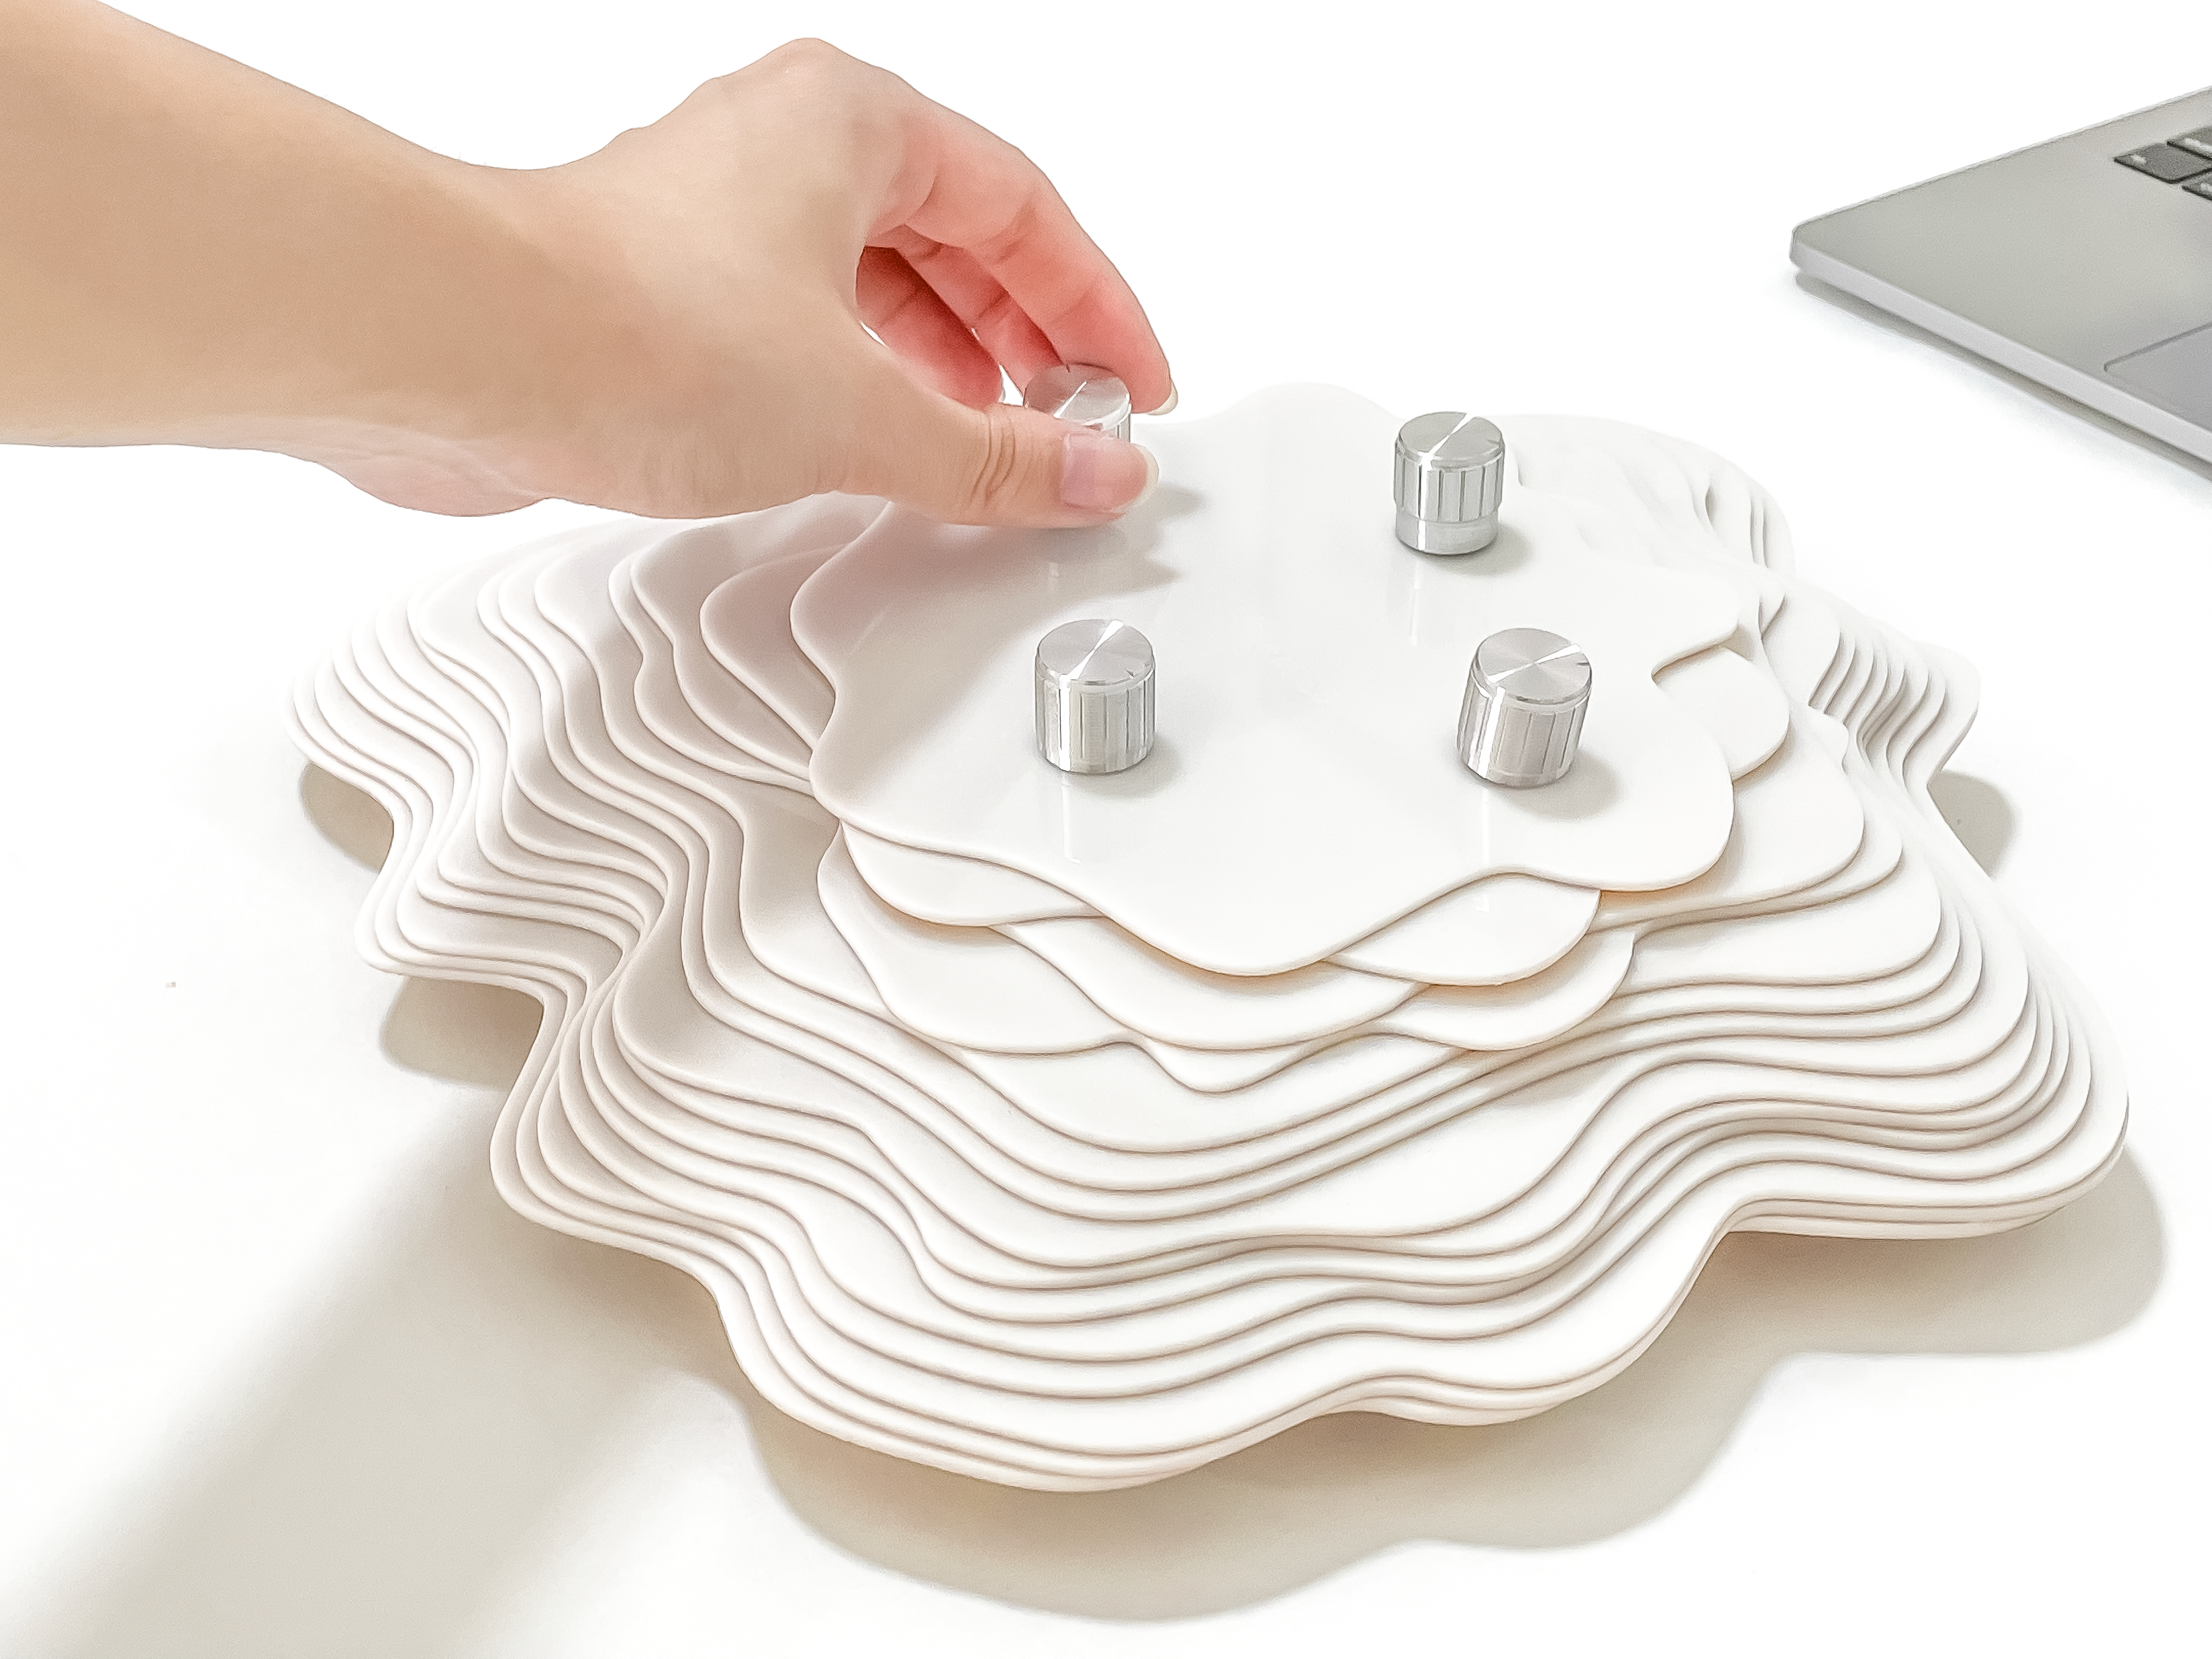
Users are to input their screentime data by turning each potentiometer to the number of hours spent on each screentime category. The reported data will then generate the relative distortions on the visual. The potentiometers are strategically positioned to reflect the digital visual. Labels of the screentime categories are also laser-etched below each potentiometer.
The convexity of distortions will suggest the number of hours spent on each screentime category. The screentime values is collated in a data chart at the top, labels signifying each screentime category are also situated alongside the distortions to guide users in reading the data. When levels of distortions are compared, screentime trends can easily be identified. As such, participants are able to infer online behavioural patterns and formulate their digital identities from the prototype.